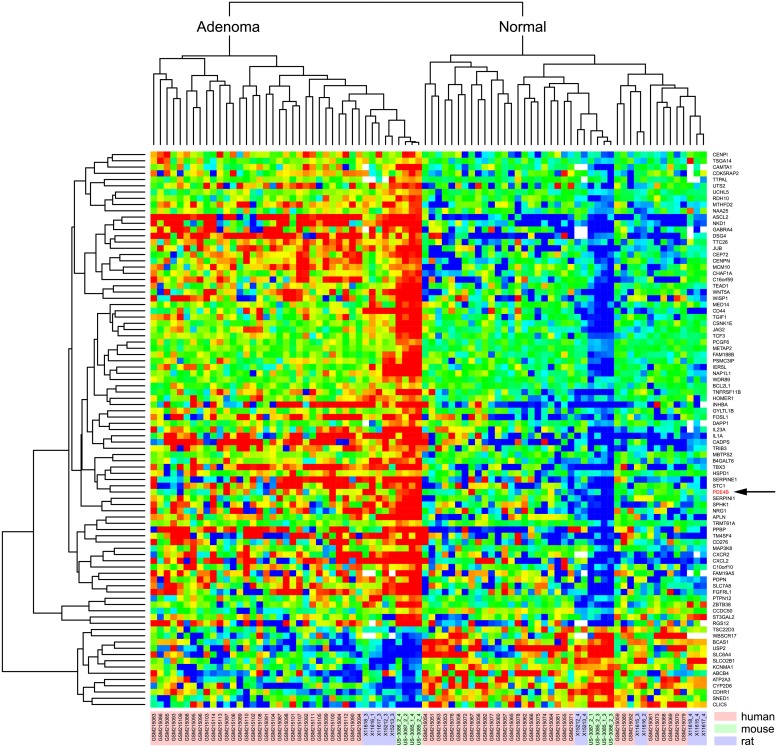
Fig 5. Heatmap summarizing the transcript levels from 89 genes (75 up; 14 down) that show altered expression in all three genera.
Both the mouse and the rat models are genetically homogeneous, whereas the human is not. Thus, genetic heterogeneity can explain the dispersion of the human data. Color indicates deviation from gene- and genus-specific average expression (log2 scale). The arrow notes the position of the Pde4b/PDE4B transcript.

