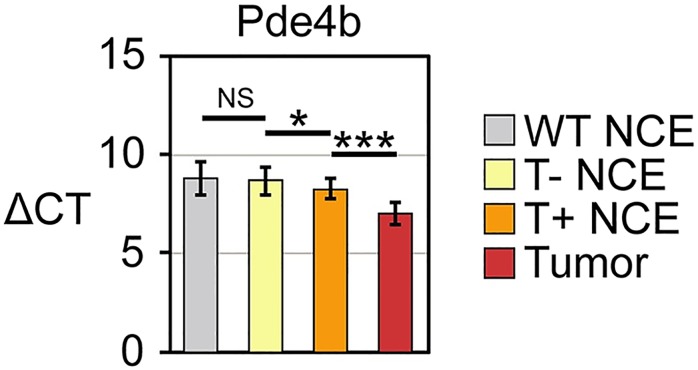
Fig 8. Real time PCR analysis of transcripts that differ in level between the ApcMin/+ adenoma and the normal colonic epithelium of tumor-bearing versus tumor-free ApcMin/+ mice.
Real time PCR results for transcripts of the normal colonic epithelium (NCE) whose level differ between ApcMin/+ mice bearing colonic adenomas (T+) and ApcMin/+ mice free of colonic tumors (T-). The cycle number (ΔCT), normalized to GAPDH, is shown on the Y axis. The relevant significant pairwise comparisons are marked: * for p ≤ 0.05; ** for p ≤ 0.01; *** for p ≤ 0.001; NS for Not Significant. WT, wildtype.

