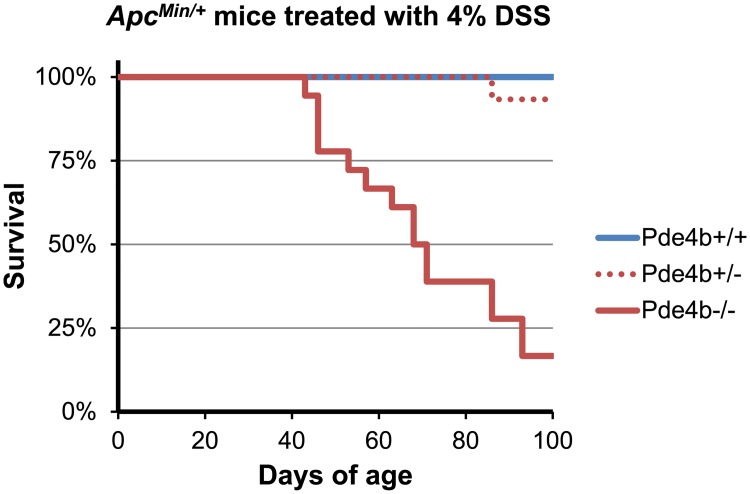
Fig 10. Kaplan-Meier survival curve of 4% DSS-treated Apc Min/+ mice versus Pde4b genotype.
The distribution of ages at which 4% DSS treated Apc Min/+ mice of Pde4b+/+, Pde4b+/- and Pde4b+/- genotypes became moribund is presented as Kaplan-Meier survival curves. Pde4b-/- mice demonstrate significantly accelerated morbidity compared to either Pde4b+/- or Pde4b+/+ mice.

