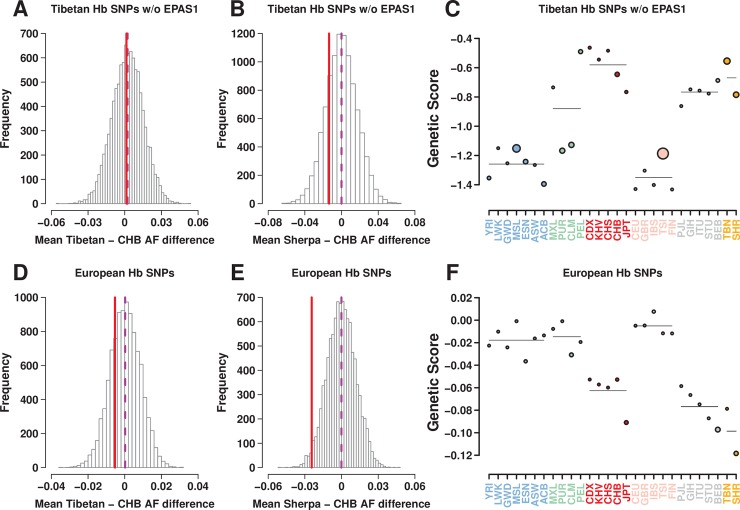
Fig 3.
Tests of polygenic adaptation of Hb-associated SNPs: (A-C) 35 SNPs from our Tibetan GWAS (p ≤ 10−4) after excluding the EPAS1 SNP rs372272284, and (D-F) 91 genome-wide significant SNPs from a large GWAS of mostly European cohorts. The mean frequency differences of trait-increasing alleles between Tibetans and CHB (A, D) and between Sherpa and CHB (B, E) were presented (solid red line) together with the empirical null distribution of 10,000 sets of matched random SNPs. (C, F) The genetic values of populations (filled dots) and of regions (horizontal lines) were plotted. The size of dots and the width of lines are proportional to the significance of the corresponding outlier test.

