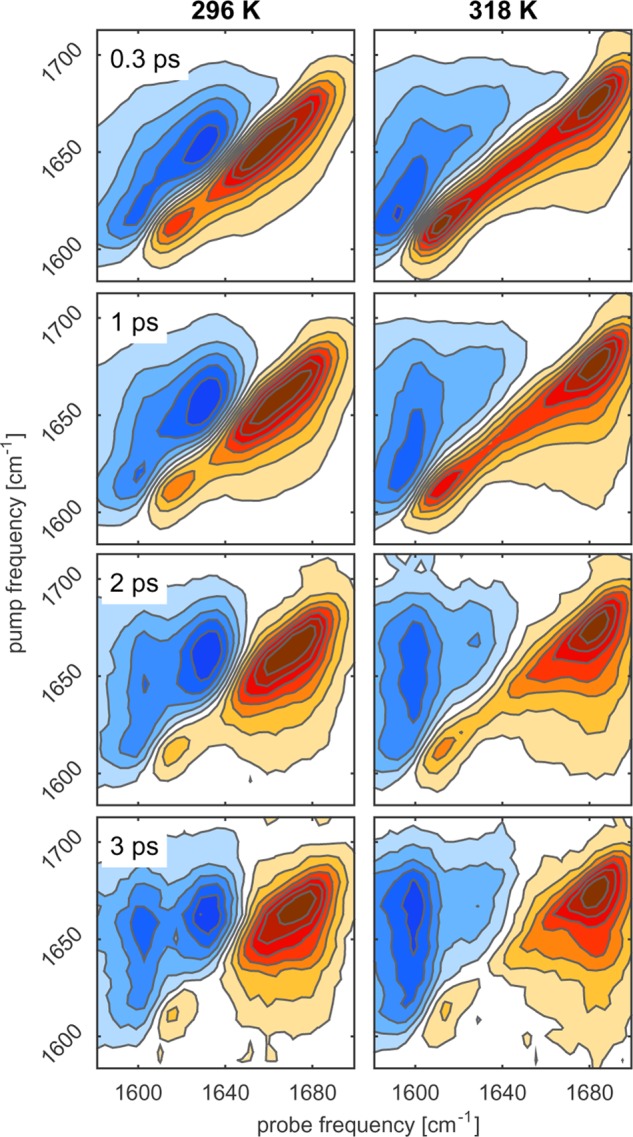
Figure 4.

Isotropic 2DIR spectra of ELP90 in D2O (20 mg/mL) at different pump–probe delays and for two different temperatures. Negative absorption changes are depicted in red and positive absorption changes in blue. The contour lines are drawn equally spaced at 12.5% increments.
