Figure 6.
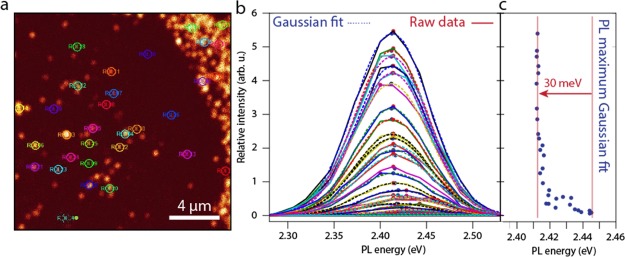
Confocal microspectroscopy on individual CsPbBr3 NC SPs. (a) Confocal micrograph of a glass slide covered with SPs, which appear as high intensity areas on a dark background. The circles indicate the areas in which the PL signal was integrated. (b) PL spectra of a large number of different regions in the confocal micrograph shown in (a). The solid lines indicate raw data, whereas the dashed lines are Gaussian fits to the data. (c) Comparing the peak intensity to the PL energy, a red shift of roughly 30 meV is observed for the SPs compared to the NC monolayer background.

