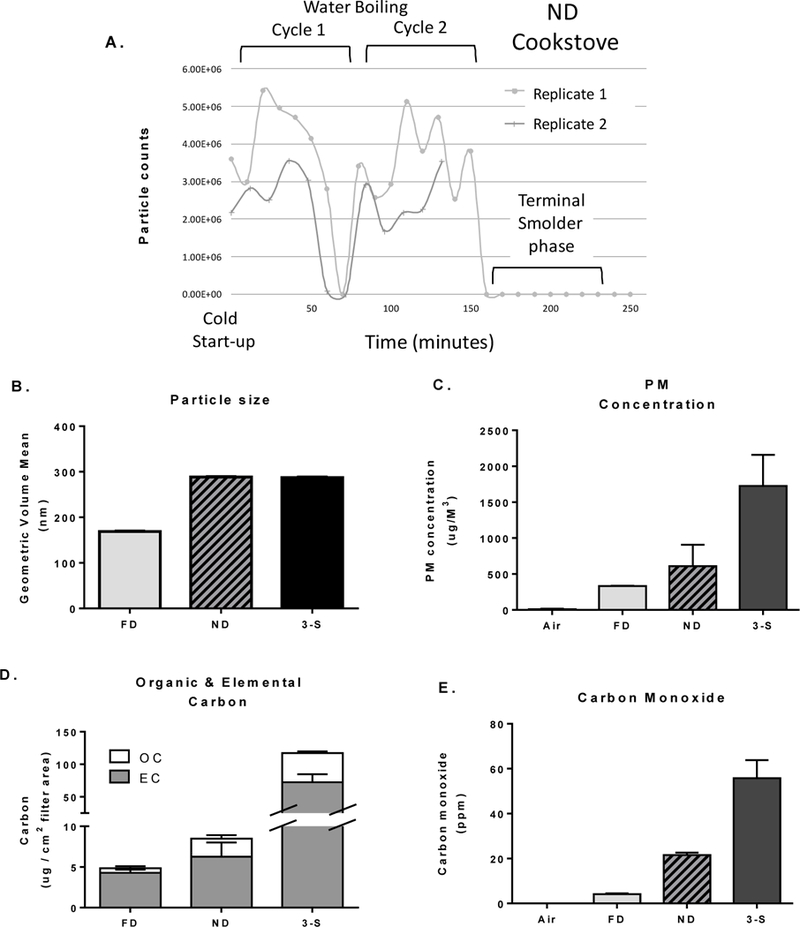
Figure 1.

Characterization of cookstove emissions within the NOEC. (A) Example of real-time particle counts generated by the ND stove across the cold start-up and two consecutive water boiling cycles, replicate 1 and 2; (B) mean of the particle volume diameter (nm) assessed by SMPS; (C) mean PM concentrations (μg/M3) for each CS system; (D) relative elemental carbon (EC) and organic carbon (OC) contained in emitted PM; and (E) mean carbon monoxide concentrations (ppm). Figures depict the mean (± SD) of the two replicates for each stove week.
