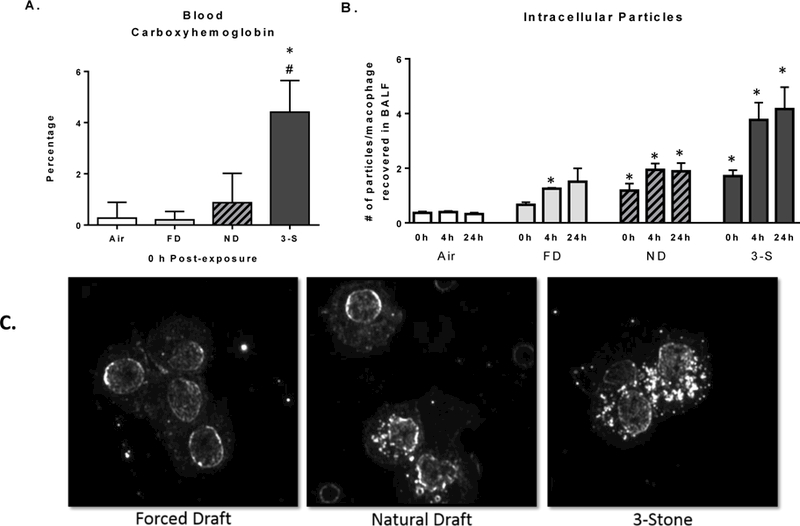
Figure 3.

Biomarkers of exposure to CS emissions. (A) Blood % carboxyhemoglobin concentrations at 0 h PE; (B) number of particles visible in macrophages obtained via lung lavage at 0, 4, and 24 h PE; and (C) dark field microscopy (40X magnification) images show particles (white dots) within cell boundaries of phagocytic cells at 24 h PE. Data represent the mean (±SE) of n = 8 mice/group for the FD (light bars), ND (grey bars with hatches), and 3-S fire (solid black bars) exposed groups. *Significantly different than the air control group at the corresponding time PE. #Significantly different than all other CS groups at the corresponding time PE.
