Figure 6.
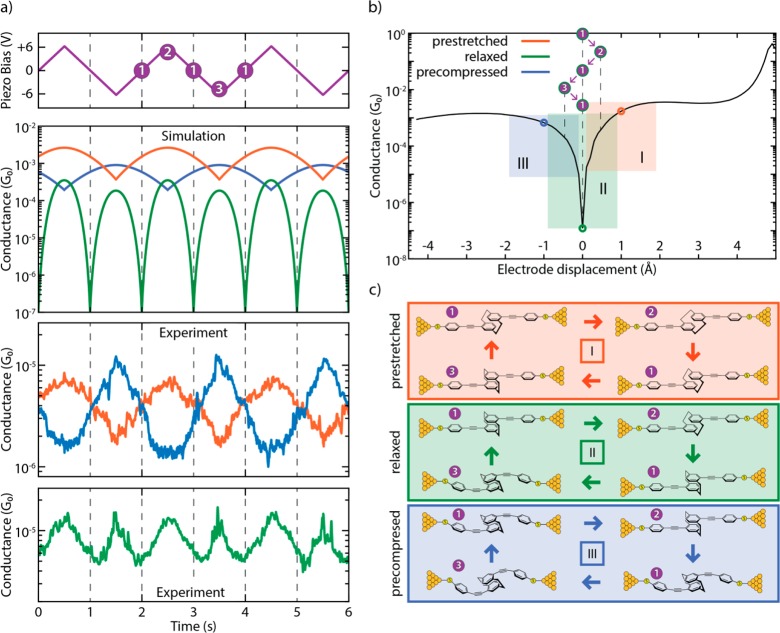
(a, top panels) Simulation of conductance traces (second panel) when the electrode displacement is periodically modulated (top panel) for three different trapping configurations: pre-stretched (orange), relaxed (green), and pre-compressed (blue). Centers of oscillation at +1, 0, and −1 Å, respectively; amplitude of 0.5 Å. (a, bottom panels) Zoomed-in panel showing the experimental distance-modulation traces presented in Figure 3. (b) Calculated conductance vs electrode displacement. The blue, green, and orange areas (I, II, and III, respectively) show the portion of the curve spanned in the case of different starting positions (pre-compressed, relaxed, and pre-stretched, represented by circles in the same colors). The numbers in the purple circles represent the position of the electrodes along the oscillation period in the case of a relaxed trapping configuration. (c) Schematics of the molecular configurations along a period of electrode distance modulation. Different starting configurations are represented with different colors: pre-stretched in orange, relaxed in green, and pre-compressed in blue. White numbers in purple circles represent the position of the electrodes along the oscillation period. Note that the molecular compression and elongation in the simulation is 0.5 Å, a value smaller than the gap-size variation in the experiment. This can be rationalized by the elastic response of the sulfur–gold connections and of the gold atoms in the electrodes themselves.

