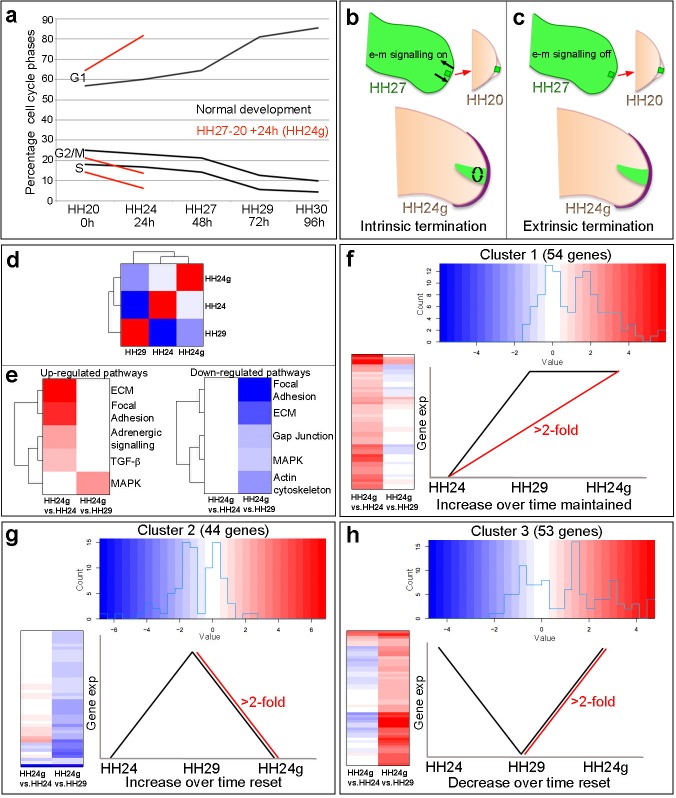
Figure 1. Cell cycle and RNA-seq analyses of chick wing distal tips.
(a) Decline in cell cycle rate determined by proportions of cells in G1-, S- and G2/M-phases between HH20 and HH30 in the distal chick wing bud (black lines Saiz-Lopez et al., 2017). Red lines show maintenance of cell cycle program in grafts of HH27 distal tips made to HH20 wing buds left for 24 hr until HH24 (HH24g - tissue would have progressed from HH27 to HH29 in donor) – note trajectories follow same pattern as black lines between HH27 and HH29. (b–c) Procedure for making HH27-20 grafts (Saiz-Lopez et al., 2017) and predictions for loss of proliferative growth in HH24g mesenchyme. (b) Intrinsic termination: e-m signalling (arrows in HH27 wing bud) maintained between mesenchyme and apical ridge but proliferation declines intrinsically in mesenchyme independently of e-m signalling (curved arrows in HH24g mesenchyme). (c) Extrinsic termination: e-m signalling irreversibly lost between graft and apical ridge in HH27 bud (arrows absent) and proliferation lost in graft. (d) Heat-map showing the correlation (Pearson) of the normalised RNA-seq data collapsed to the mean expression per group and the degree of correlation indicated by the colour (red: higher, blue: lower). (e) KEGG analyses across pairwise contrasts with degree in pathway change indicated by the colour (red: up-regulated, blue: down-regulated). (f–h) Clustering of RNA-seq data across pairwise contrasts with degree of gene expression change indicated by the colour (red: higher, blue: lower). (f) Cluster 1: genes that increase between HH24 and HH29 (black line) and are maintained in HH24g (red line - > 2 fold higher in HH24g than HH24). (g) Cluster 2: genes that increase between HH24 and HH29 (black line) and reset in HH24g (red line - > 2 fold lower in HH24g than HH29). (h) Cluster 3: genes that decrease between HH24 and HH29 (black line) and reset in HH24g (red line - > 2 fold higher in HH24g than HH29).
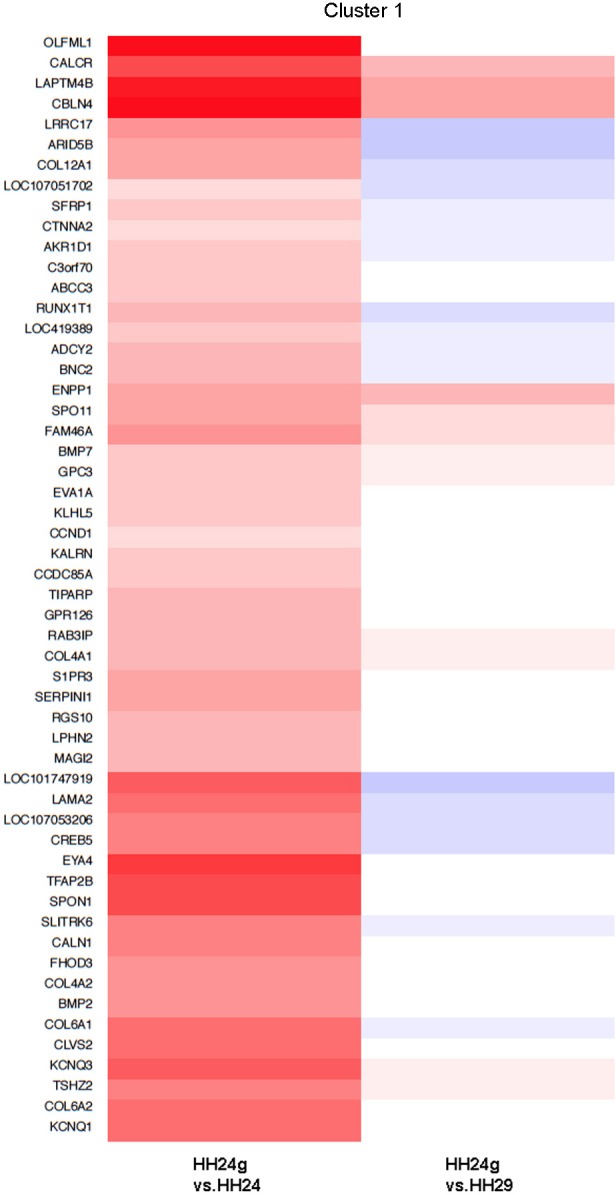
Figure 1—figure supplement 1. Cluster 1 Clustering of RNA-seq data across pairwise contrasts with degree of gene expression change indicated by the colour (red: higher, blue: lower).

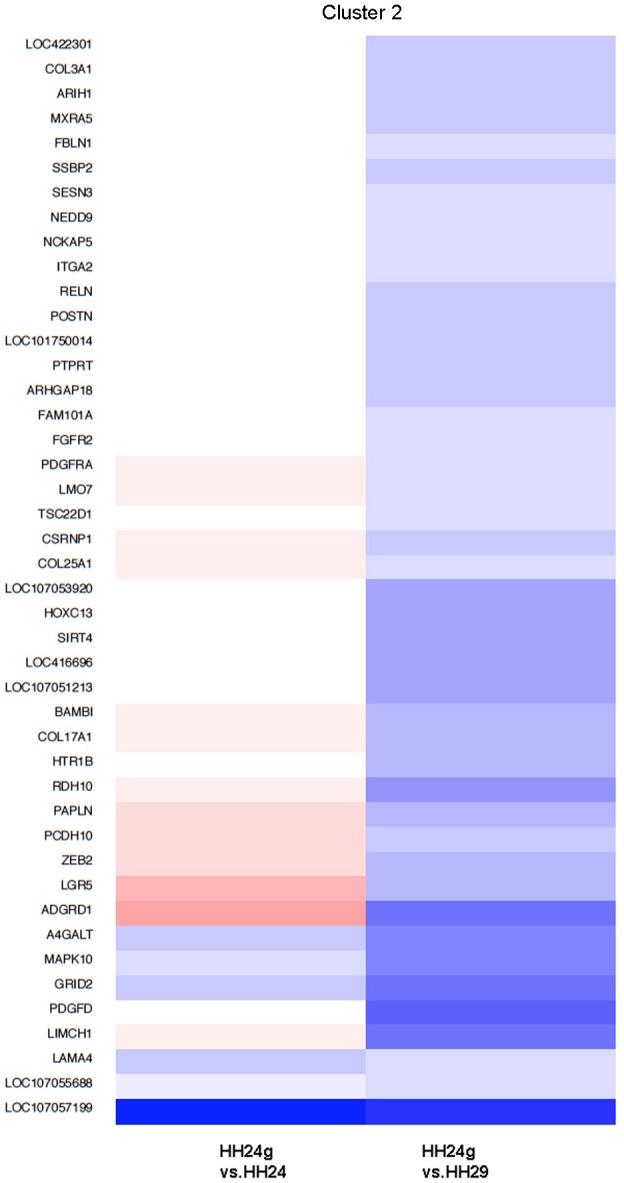
Figure 1—figure supplement 2. Cluster 2 Clustering of RNA-seq data across pairwise contrasts with degree of gene expression change indicated by the colour (red: higher, blue: lower).

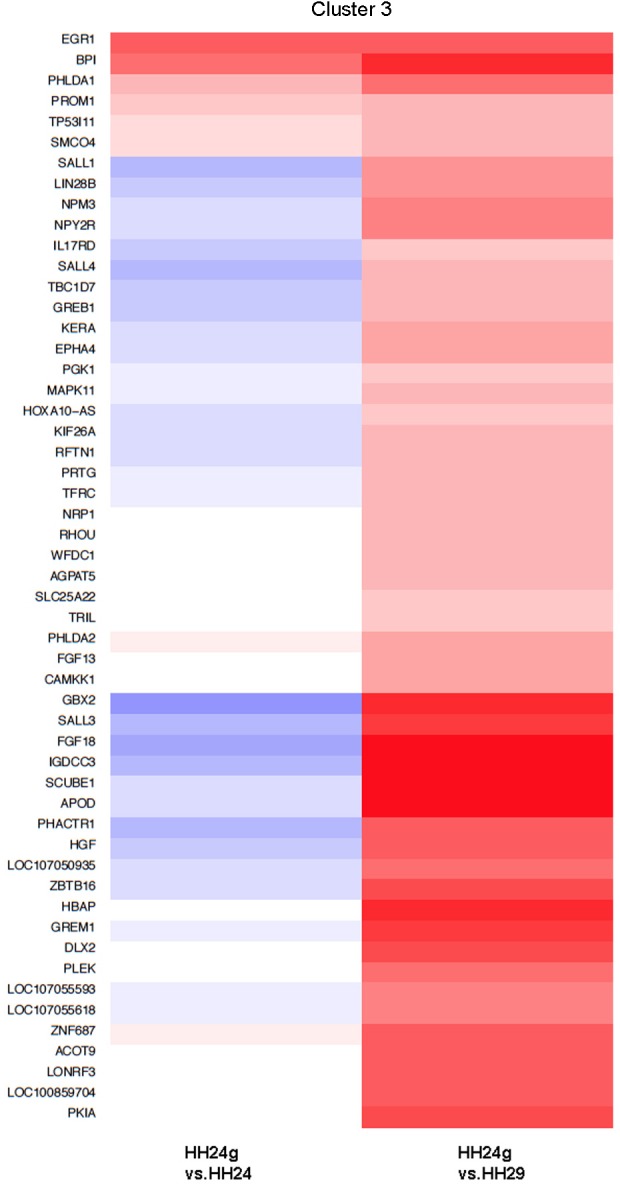
Figure 1—figure supplement 3. Cluster 3 Clustering of RNA-seq data across pairwise contrasts with degree of gene expression change indicated by the colour (red: higher, blue: lower).


