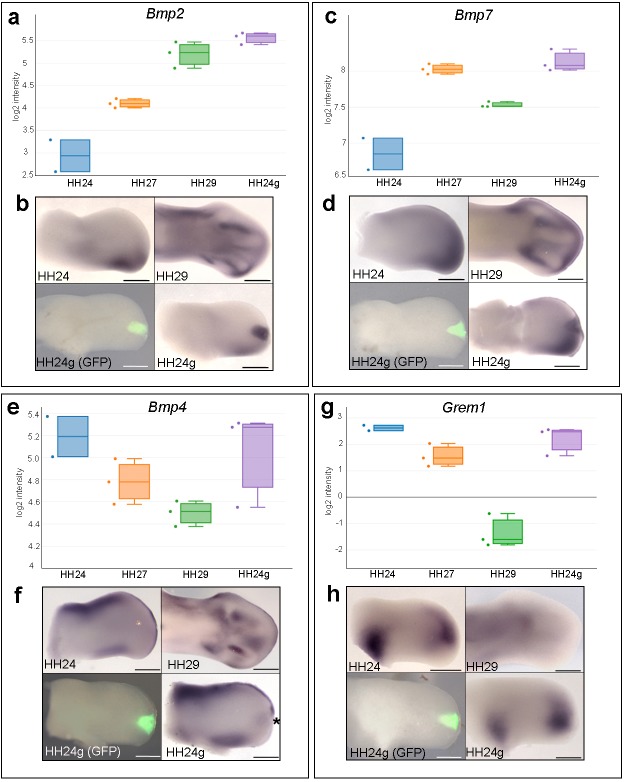
Figure 2. Bmp2/4/7 and Grem1 expression in HH24g mesenchyme.
(a) Histogram showing expression levels of Bmp2 as normalised log2 values of RNA sequencing read-count intensities. (b) In situ hybridization showing Bmp2 expression - note intense expression in HH24g mesenchyme in area of graft (n = 3/3, HH24 is the contralateral bud flipped horizontally). (c) Expression levels of Bmp7 determined by RNA-seq. (d) In situ hybridization showing Bmp7 expression - note intense region of expression in HH24g mesenchyme (n = 3/3). (e) Expression levels of Bmp4 determined by RNA-seq. (f) In situ hybridizations showing Bmp4 expression - note enhanced expression in HH24g mesenchyme in area of graft (asterisk - n = 2/3). (g) Expression levels of Grem1 determined by RNA-seq. (h) In situ hybridizations showing resetting of Grem1 expression (n = 7/9). Scale bars: HH24 buds - 500 μm; HH29 buds - 200 μm.

