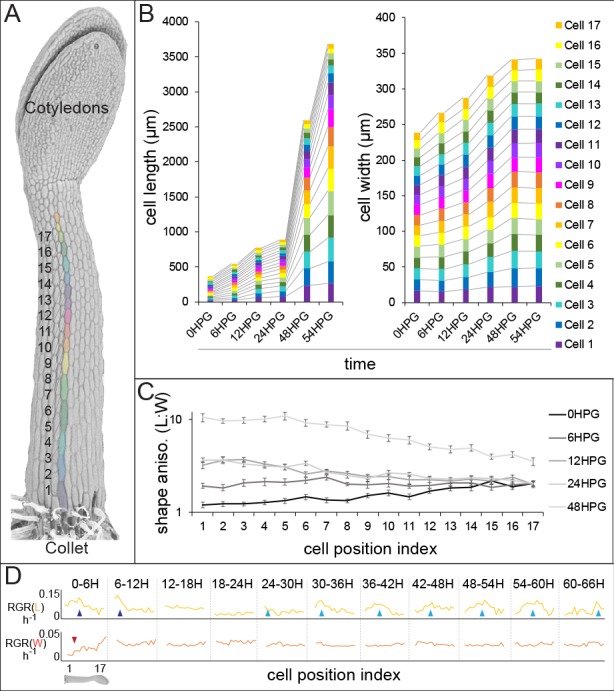
Figure 1. Hypocotyl epidermal cells exhibit a wave of growth in length and not in width.
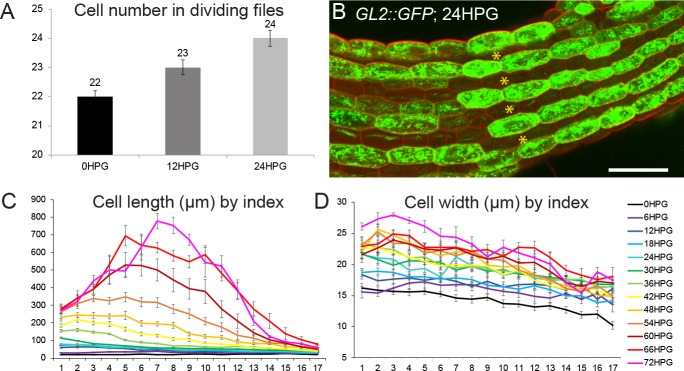
(A) A scanning electron micrograph of a 24HPG etiolated hypocotyl showing cell indices in a non-dividing cell file, numbered from the collet to the cotyledons. (B) Cell length and width by cell position index displayed from 0-54HPG. (C) Cell shape anisotropy (length:width) by cell index from 0-48HPG. (D) Relative growth rates (RGR) for length and width of cells by index from 0-66HPG, in 6H windows. Data in B-D were collected from 20 hypocotyls per time point imaged by confocal microscopy, from at least two non-dividing files per hypocotyl. The data in B are presented without error bars to make visualization possible; standard errors can be found in Figure 1—figure supplement 1. RGR values and standard errors can be found in Supplementary file 1. Blue arrowheads point to early-pulse growth adjacent to the collet, red arrowheads to early growth suppression, light blue arrowheads trace the maximal RGR(L) and proxy the acropetal wave.


