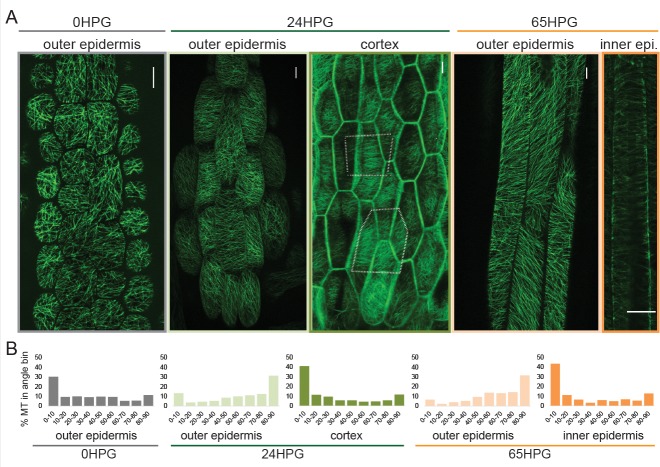
Figure 2. Microtubule alignment is weakly transversely aligned early in hypocotyl growth.
(A) Representative images of microtubule organization as visualized with 35S::GFP-MAP4 at 0HPG, 24HPG and 65HPG. Scale bars = 10 µm. Location of images reported as: outer or inner epidermal face, or cortex. Dotted outlines in cortex image indicate cortex cell outlines. (B) Frequency distribution of microtubule angle grouped in 10 degree intervals from 0HPG to 65HPG using MicroFilament Analyzer (MFA); sample numbers were: 0HPG: n = 65 cells (from 5 hypocotyls); 24HPG: n = 30 (from 9 hypocotyls); 65HPG: n = 13 (from 6 hypocotyls). For 24HPG cortex analysis, n = 36 (from 5 hypocotyls). Examples of MTs at 24HPG outer epidermal faces visualized with 35S::GFP-TUA6, 35S::GFP-EB1 and CESA3::CESA3-GFP are found in Figure 2—figure supplement 1.


