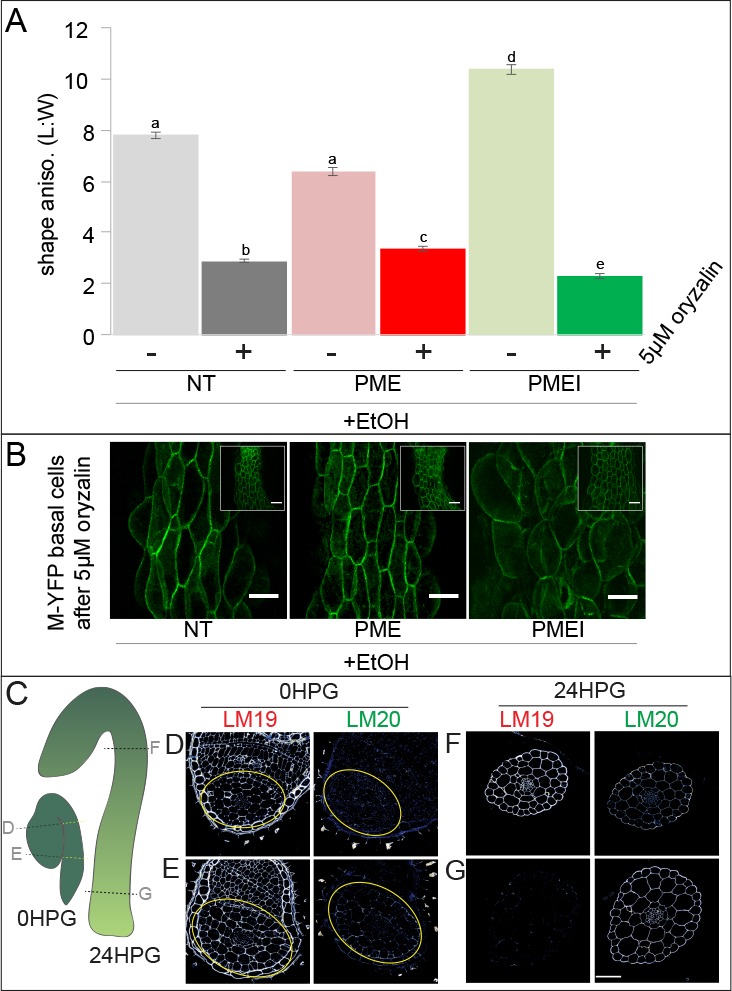
Figure 6. Pectin biochemistry contributes to wall mechanical strength and its changes correlate with the acropetal wave.
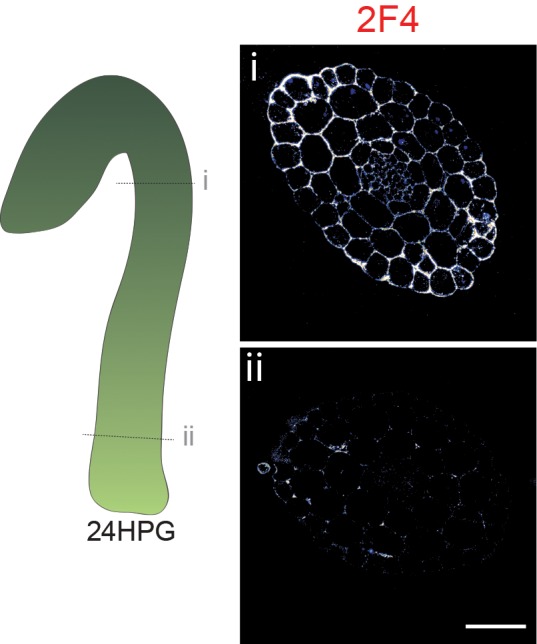
(A) Shape anisotropy (length/width) of cells at the bottom of treated and control hypocotyls. Error bars represent the standard error of the mean. All seedlings were treated with the inducer (ethanol; EtOH). Scale bars = 100 µm. a,b,c,d,e indicate similarity based on pairwise t-tests (p<0.005). (B) Representative images of basal cells from NT, PME5 and PMEI3 induced hypocotyls expressing the Myr-YFP membrane marker grown for 48 hr on media containing 5 μM oryzalin. (C) Diagrammatic representation of 0HPG and 24HPG hypocotyls showing the relative positions of transverse sections in D-G. (D–G) Representative immunolocalizations on transverse sections of 0HPG and 24HPG hypocotyls for de-methylated and methylated pectin (LM19 and LM20 respectively). Yellow lines (C) and circles (D,E) demark the hypocotyl where sections included cotyledons. Scale bar = 50 µm. 2F4 immunolocalization at 24HPG may be found in Figure 6—figure supplement 1.

Figure 6—figure supplement 1. 2F4 immunolocalization at 24HPG.

