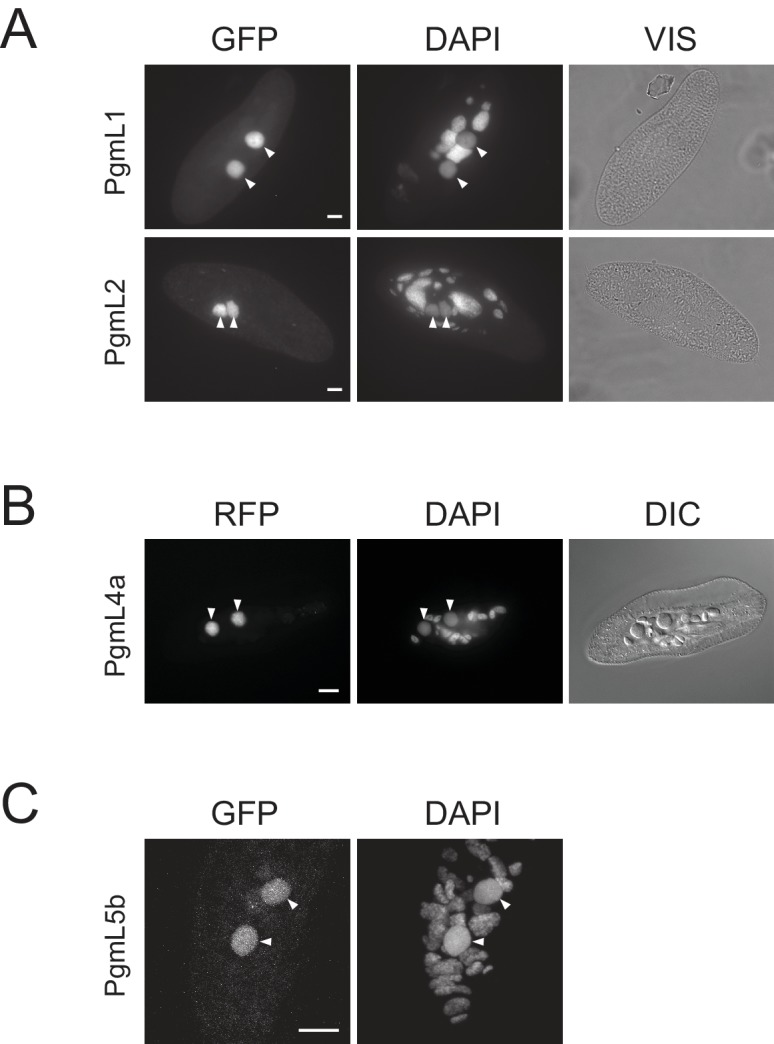
Plasmids expressing GFP-PgmL1, GFP-PgmL2 and GFP-PgmL5b are derivatives of pUC19 and carry the EGFP coding sequence (
Singh et al., 2014) fused to the 5’ end of each
PGML coding sequence. They were linearized with
ScaI (
PGML1 and
2) or
NdeI (
PGML5b) prior to microinjection. Plasmid expressing PgmL4a-RFP is a derivative of pBL49g (
Baudry et al., 2009), in which the
PGM gene and its 5’ and 3’ UTRs were first replaced by the
PGML4a gene and its upstream and downstream regulatory sequences: in this construct, a codon-optimized sequence encoding a TSSGGGSG linker followed by the mRFPmars protein was inserted between the last codon of
PGML4a and the TGA stop codon. It was linearized with
NgoMIV prior to microinjection. All plasmids carry the 5’ and 3’ transcription signals of the appropriate
PGML gene (sequences available upon request). Following microinjection into the MAC of vegetative cells, transgenes are capped by addition of telomeric repeats at their ends (concatemers may form prior to telomere addition): they may then integrate into the somatic genome (through a mechanism that remains to be studied) or be maintained throughout vegetative growth as autonomously replicating mini-chromosomes (
Gilley et al., 1988;
Bourgain and Katinka, 1991;
Katinka and Bourgain, 1992). Replication origins have not been characterized in
Paramecium, but any injected DNA (including bacterial plasmids) may be replicated. Transgenes persist in old MAC fragments throughout autogamy and continue to be expressed if controlled by proper transcription signals, but are lost in the next sexual generation, after complete destruction of the old MACtransformed cells were grown for ~20 vegetative divisions and starved to induce autogamy. (
A) Autogamous cells expressing GFP-PgmL1 or GFP-PgmL2. Cells were fixed for 10 min in 2% paraformaldehyde 1X PHEM, and stained with DAPI for 10 min before mounting them in Citifluor AF2 antifading solution (Biovalley). Epifluorescence microscopy imaging was performed using a Nikon Eclipse microscope, with a 63x oil objective. VIS: whole cells visualized under brightfield illumination. (
B) Autogamous cell expressing PgmL4a-RFP. Cells were fixed using a previously published procedure (
Marmignon et al., 2014) and epifluorescence microscopy imaging was performed as described (
Dubois et al., 2017). DIC: whole cells visualized using differential interference contrast microscopy (Normarski). (
C) Autogamous cell expressing GFP-PgmL5b. Cells were fixed and stained as mentioned in (
Ignarski et al., 2014) for the immunostaining of histone modifications. Confocal imaging was carried out using an Olympus Fluoview Fv1000 confocal laser scanning microscope, with a 63X zoom four objective. Image analysis was performed using ImageJ 1.5 r. In all panels, the white bar represents 10 µm and arrowheads indicate the position of developing new MACs.


