. 2018 Sep 18;7:e37927. doi: 10.7554/eLife.37927

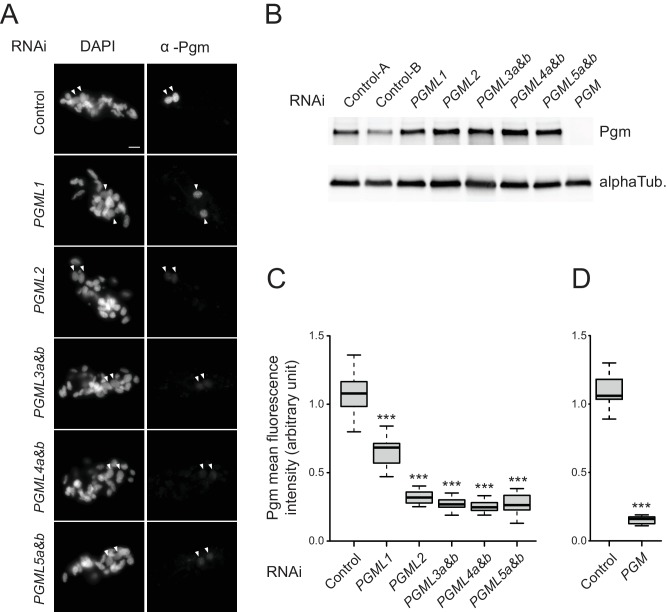
Figure 4. Expression and localization of Pgm in PGML KDs.

(A) Immunostaining of Pgm in early autogamous cells subjected to control (L4440) or PGML RNAi. Developing MACs are indicated by white arrowheads. Scale bar is 10 μm. (B) Western blot analysis of Pgm expression in early autogamous cells subjected to control (L4440: two independent controls A and B are shown), PGML or PGM RNAi. (C) Boxplot representation of the distribution of Pgm fluorescence intensities quantified in 30–55 μm2 developing MACs subjected to the different RNAi shown in (A). This size window corresponds to the maximal Pgm signal in the control (Figure 4—figure supplement 1) and was chosen to quantify nuclear Pgm immunofluorescence for all KDs, since no significant size difference was noticed for developing MACs relative to the control. For each condition, 19 to 35 developing MACs were analyzed. (D) Independent set of experiments showing the quantification of Pgm fluorescence intensity in 30–55 μm2 developing MACs following control (ND7) or PGM RNAi. 11 and 12 MACs were analyzed, respectively. In (C) and (D): *** for p<0.001 in a Mann-Whitney-Wilcoxon statistical test (see Materials and methods for details).

Figure 4.

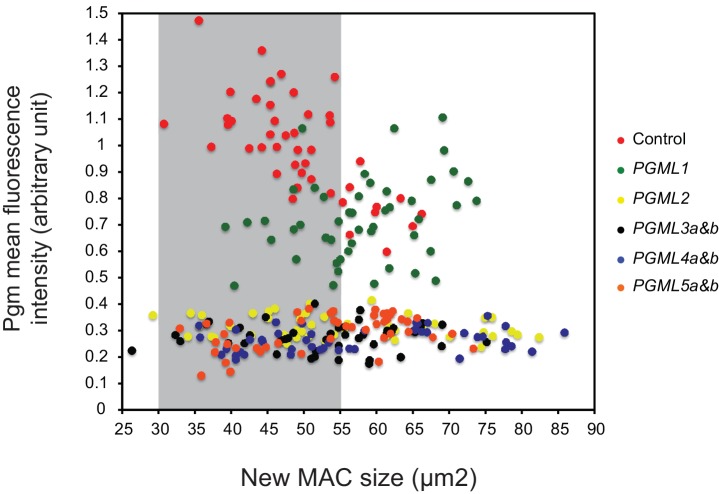
Figure 4—figure supplement 1. Plot of Pgm mean immunofluorescence intensity vs developing MAC size in cells subjected to control or PGML RNAi.

Figure 4—figure supplement 1.

For each RNAi condition, 44 to 48 developing MACs were analyzed on slides carrying whole cells immunostained with α-Pgm antibodies (Figure 4). The Pgm mean fluorescence intensity was plotted against the size of the developing MACs. As previously reported, the intensity of the Pgm signal varies during MAC development (Dubois et al., 2017). In control experiments (here using L4440), maximal level of Pgm expression was observed for MAC sizes ranging between 30 and 55 μm2: this size window is highlighted in grey.
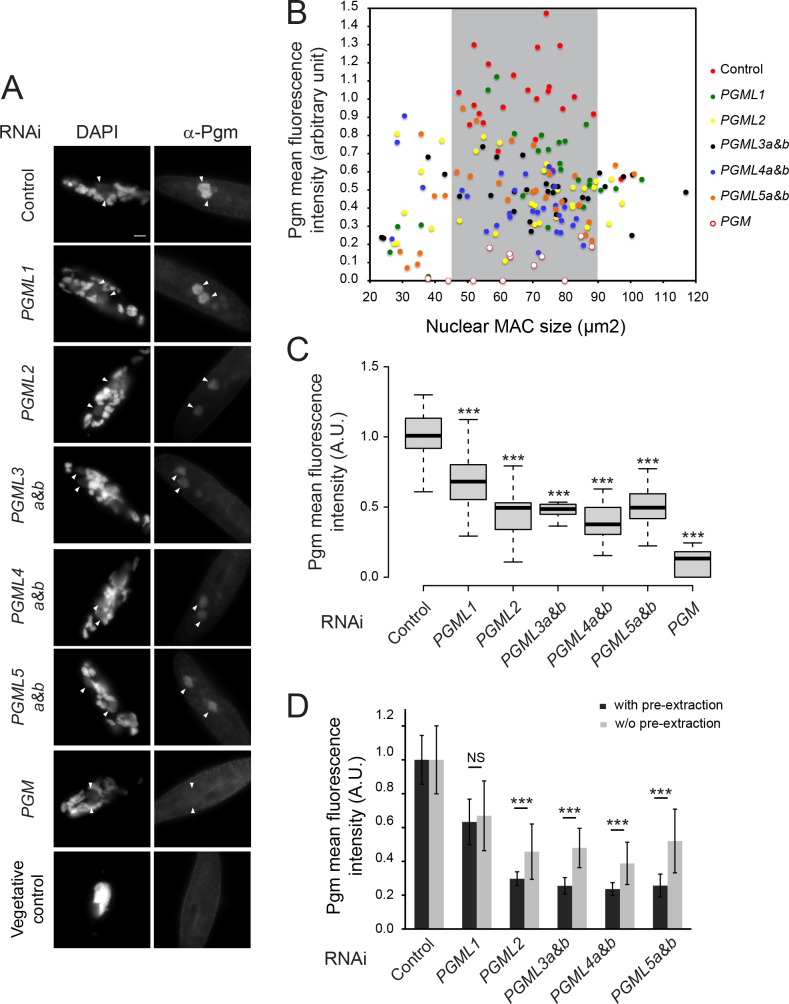
Figure 4—figure supplement 2. Immunolocalization of Pgm without Triton extraction in PGML knockdowns.

Figure 4—figure supplement 2.

(A) Immunostaining of Pgm in cells subjected to control (L4440), PGML or PGM RNAi. Cells were fixed for 10 min in PHEM +2% formaldehyde, permeabilized for 15 min in PHEM +1% Triton before TBST +3% BSA washes. The following steps of the immunostaining were performed as described in the supplementary Materials and methods. Developing MACs are indicated by white arrowheads. The last panel (Vegetative control) shows the background immunostaining of a vegetative cell in the control RNAi culture. Scale bar is 10 μm. (B) Plot of Pgm mean fluorescence intensity vs size in developing MACs. Since background immunostaining is relatively high under these experimental conditions, the mean Pgm fluorescence intensity was calculated by measuring the mean fluorescence intensity in developing MACs minus the mean fluorescence intensity for vegetative cells on the slide. Under these experimental conditions, the size of the developing MACs is larger than in standard immunostaining conditions including the pre-extraction step (Figure 4—figure supplement 1), and the maximum level of Pgm in control cells is observed for MAC sizes falling within the 45–90 μm2 range (highlighted in grey). 12 to 33 developing MACs were quantified for each condition. (C) Boxplot representation of Pgm mean fluorescence intensity (in arbitrary units: A.U.) for developing MACs ranging between 45–90 μm2 in size. 10 to 25 MACs were quantified for each RNAi. (D) Mean Pgm fluorescence intensity in PGML KDs after immunostaining with or without the pre-extraction step. Data plotted in (C) were compared to those plotted in Figure 4C, after normalization by the mean control value obtained in each experimental condition (with or without pre-extraction). Error bars represent the standard deviation for each dataset. *** for p<0.001 (Mann-Whitney-Wilcoxon test).