. 2018 Sep 18;7:e37927. doi: 10.7554/eLife.37927

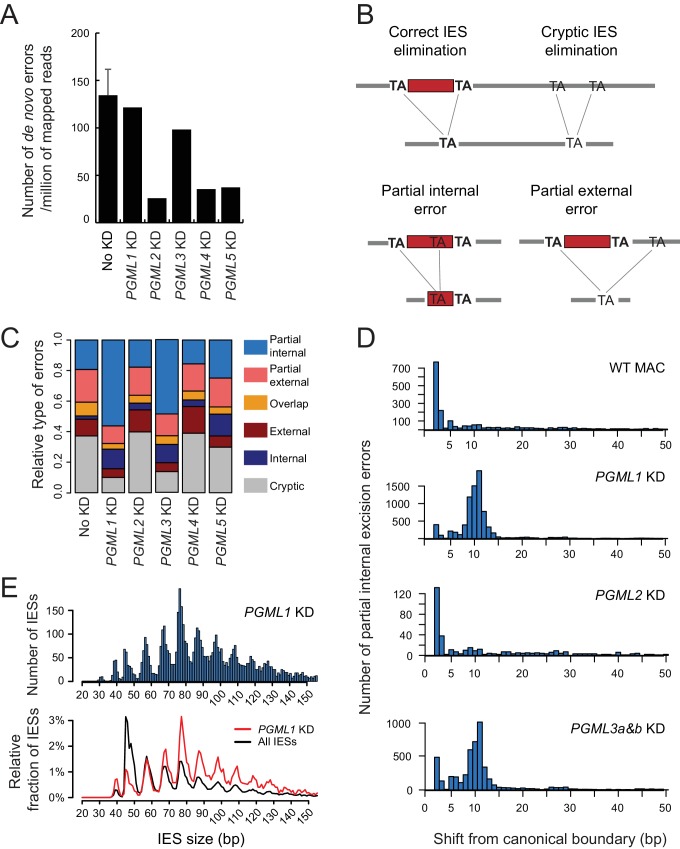
Figure 6. IES excision errors in PGML KDs.

(A) Number of IES excision errors in the MAC of vegetative cells before autogamy (No KD) and in the new MAC of autogamous cells upon each PGML KD (de novo errors). For the No KD sample, the error bar represents the standard deviation for five replicates (V samples in Supplementary file 9). (B) Major classes of IES excision errors found in the different samples. In external or internal errors, the two alternative TAs are misplaced (one on each flanking side or both inside of a reference IES, respectively). Overlapping errors use one TA inside and the other outside of reference IESs. (C) Distribution of the different classes of de novo excision errors in PGML KDs. As a control, the distribution of pre-existing errors found in the old MAC is shown for a vegetative culture (see Supplementary file 9). (D) Position of alternative excision boundaries used in partial internal excision errors, relative to the canonical boundary of the reference IES. WT: vegetative MAC; for PGML KDs, only de novo errors were considered. (E) Size distribution of IESs exhibiting partial internal errors in a PGML1 KD. Upper panel: size distribution of all IESs with partial internal errors. Lower panel: the black curve shows the fraction of IESs of each size relative to the total number of IESs in the genome; the red curve shows the fraction of IESs of each size among the population of IESs showing at least one partial internal error in a PGML1 KD. In both panels, only IESs with an alternative boundary at >2 bp from the canonical one were counted. In the bottom panel, IESs shorter than 35 bp were not considered (see Figure 6—figure supplement 4).

Figure 6.

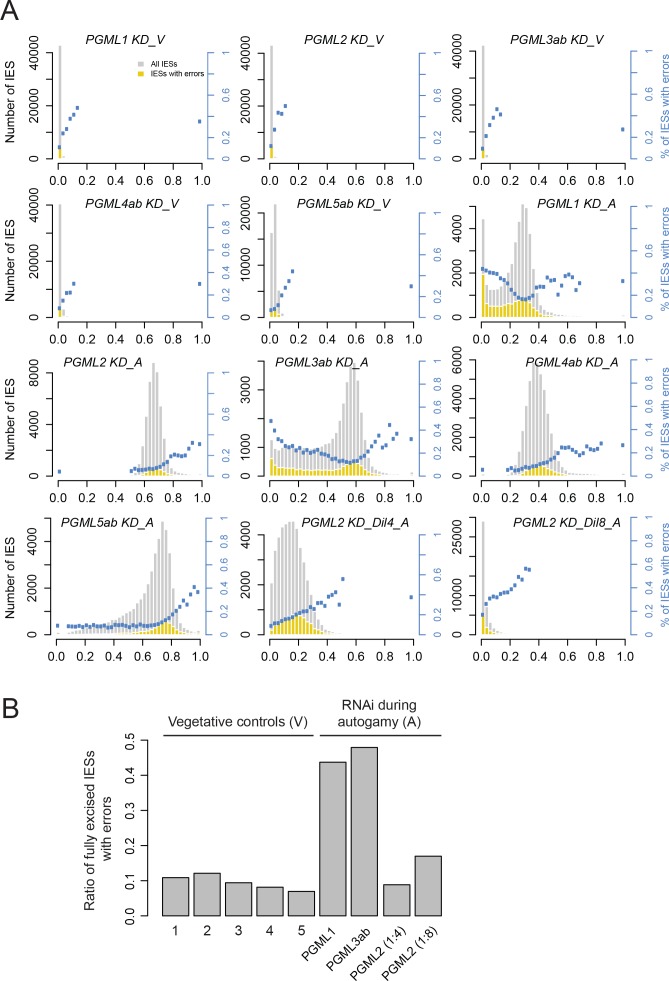
Figure 6—figure supplement 1. The number of excision errors increases for IESs with the lowest retention scores in PGML1 or PGML3a and b knockdowns.

Figure 6—figure supplement 1.

(A) Fraction of IESs with errors as a function of boundary scores. For each dataset (see Supplementary file 9), the distribution of IES boundary scores is shown in grey (interval width: 0.025). For each interval, the number of IESs showing at least one excision error is superimposed in yellow and blue dots represent the ratio of IESs with at least one error (for intervals containing at least 50 IESs). All classes of errors were considered in this analysis. To allow comparison between PGML1, PGML3 and partial PGML2 KDs, raw error counts were used for all plots. (B) Plot of the fraction of IESs showing at least one excision error among fully excised IESs (boundary score <0.025). Vegetative controls are five independent cultures before autogamy in each RNAi-inducing medium (numbers refer to PGML groups).
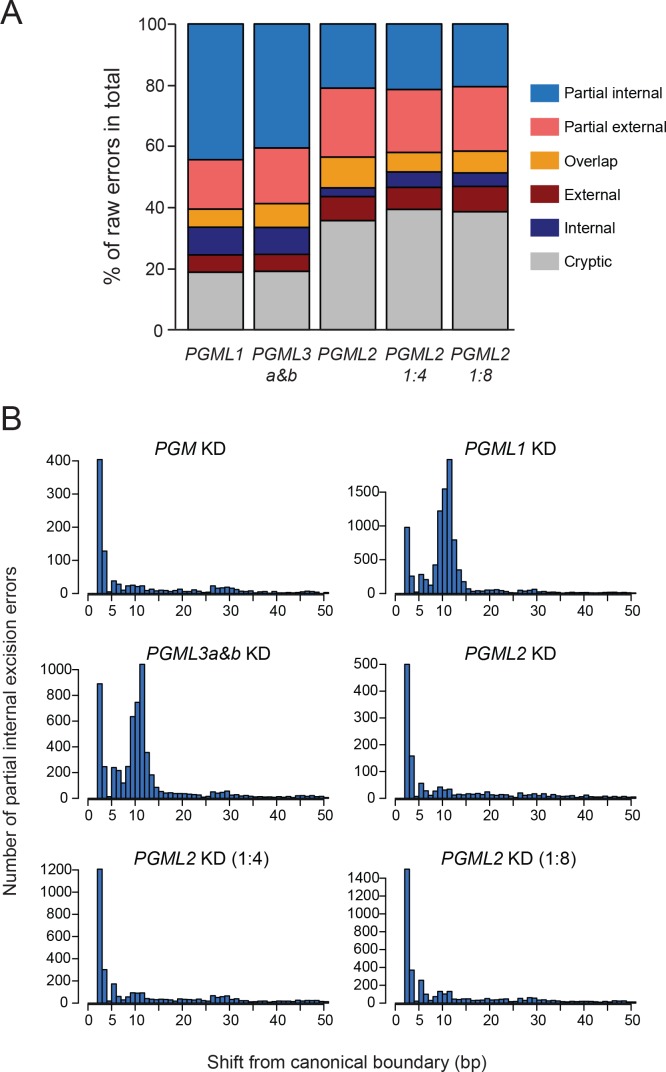
Figure 6—figure supplement 2. Raw counts of IES excision errors in PGML1, PGML3a and b and partial PGML2 knockdowns.

Figure 6—figure supplement 2.

(A) Raw counts of IES excision errors in PGML1, PGML3a and b and partial PGML2 KDs. Here, and in contrast to Figure 6C, the distribution of different classes of IES excision errors for each condition was plotted without subtracting the contribution of the old MAC from raw error counts. Over-representation of partial internal excision errors was still detected in PGML1 and PGML3a and b KDs. See Supplementary file 9 for details. (B) Position of alternative excision boundaries used in partial internal excision errors in PGM and PGML KDs, relative to the canonical boundary of the reference IES. As in panel A, all partial internal errors were considered for each sample without subtracting the contribution of the old MAC, leading to higher error counts for each position than shown in Figure 6D.
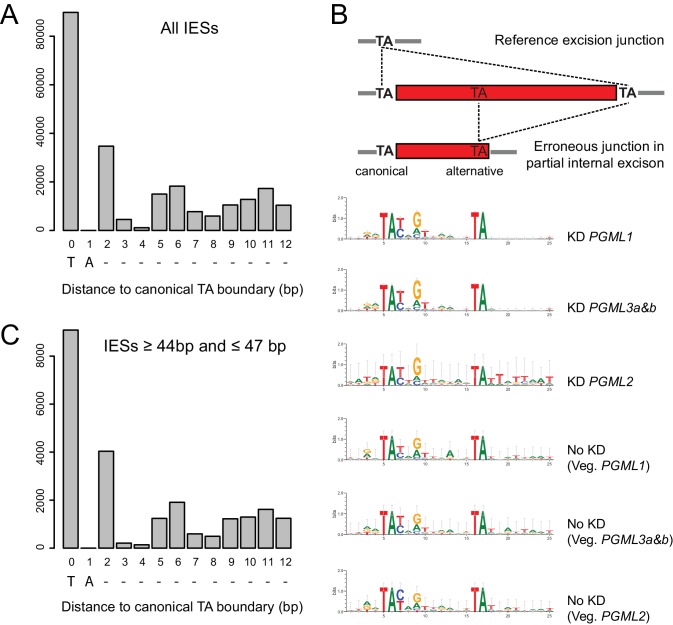
Figure 6—figure supplement 3. Alternative excision boundaries used in partial internal IES excision errors.

Figure 6—figure supplement 3.

(A) Fraction of IES ends with a TA dinucleotide localized at each indicated distance from the reference TA boundary. Position 0 corresponds to the T of the reference TA at each IES end. (B) SeqLogos of canonical (left) and alternative internal (11–12 bp distant) TAs erroneously used in PGML KDs were determined using the ‘weblogo’ software, version 3.3 (Schneider and Stephens, 1990; Crooks et al., 2004). (C) Same analysis as in panel A, restricted to IESs ranging from 44 to 47 bp in length.
Figure 6—figure supplement 4. Size distribution of IESs with partial internal excision errors in PGML1 or PGML3a and b KDs.
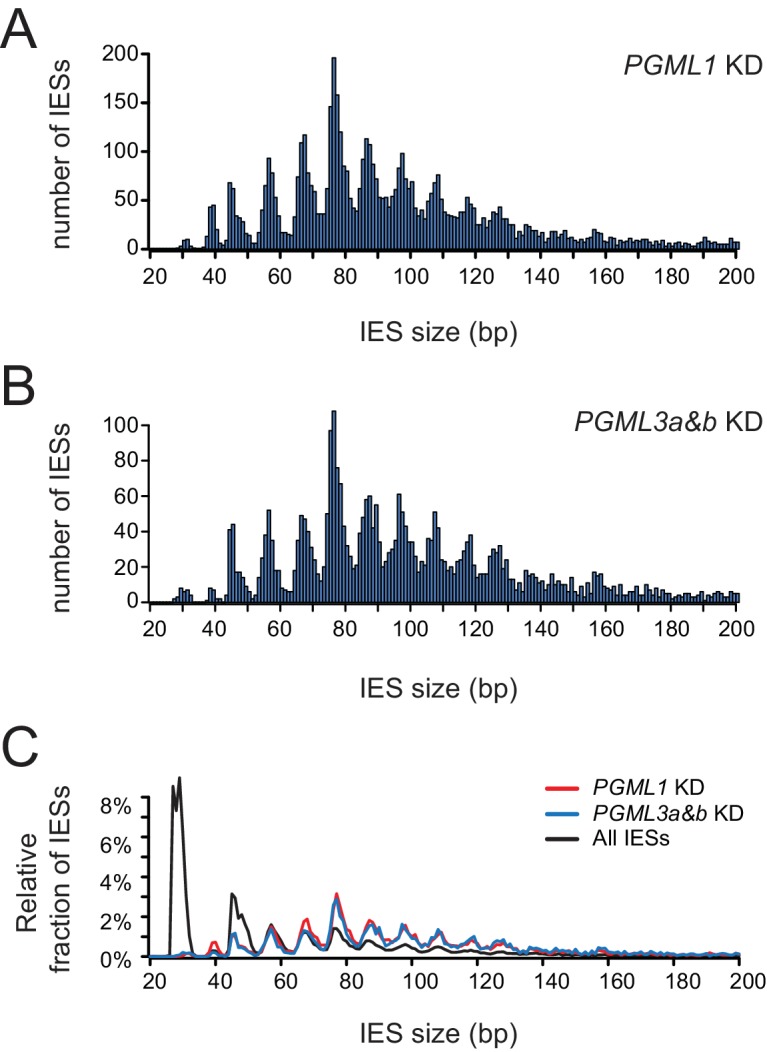
Figure 6—figure supplement 4.

(A) Size distribution of IESs exhibiting partial internal errors in a PGML1 KD. (B) Same as panel A for a PGML3a and b KD. (C) For each IES size, the black curve shows the fraction of IESs relative to total number of IESs in the genome, the red (PGML1 KD) and blue (PGML3a and b KD) curves show the fraction of IESs of each size among the population of IESs showing at least one partial internal error. In all panels, only IESs with an alternative boundary located >2 bp from the canonical one were counted.