. 2018 Aug 15;7:e38325. doi: 10.7554/eLife.38325

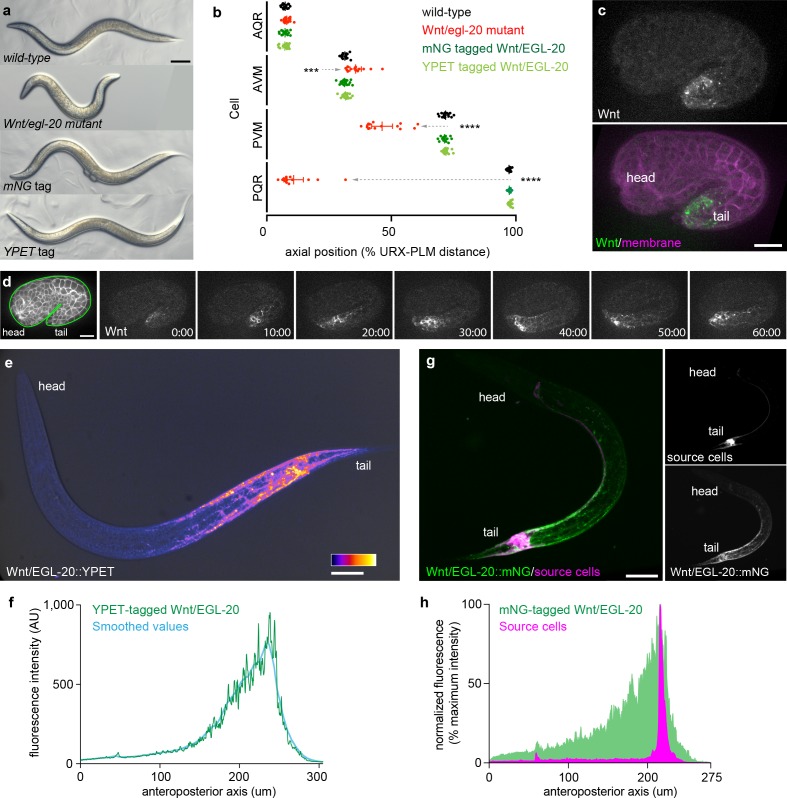
Figure 1. Tagged Wnt/EGL-20 is biologically functional and forms a long-range, anteroposterior gradient in vivo.

(a) transmitted light images of adult C. elegans with wild-type egl-20, the egl-20 loss-of-function mutant egl-20(n585), mNG-tagged egl-20, or YPET-tagged egl-20 showing normal external anatomy in mNG and YPET-tagged strains; (b) positions of QR neuroblast descendants AQR and AVM and QL neuroblast descendants PVM and PQR in wild-type, egl-20 mutant, egl-20::mNG, and egl-20::YPET strains showing that tagged EGL-20 is biologically functional for Q neuroblast migration. Dashed arrows indicate abnormal cell migrations. Means and 95% confidence intervals are shown for each cell type/genotype. Wild-type n = 15, egl-20(n585) n = 15, EGL-20::mNG n = 20, EGL-20::YPET n = 18.***, adjusted p=0.0005; ****, adjusted p<0.0001, all other comparisons adjusted p>0.9999, one-way ANOVA with Sidak’s multiple comparisons test; (c) maximum intensity projection of a comma stage embryo showing the earliest detectable Wnt/EGL-20::mNG fluorescence; (d) surface optical sections from time-lapse images of Wnt/EGL-20::mNG showing the onset of spreading from 1.5-fold to 2-fold stages; (e) maximum intensity projection of Wnt/EGL-20::YPET fluorescence in a living, late L1 stage animal illustrating the anteroposterior Wnt gradient colored with fire look-up-table and overlaid with transmitted light image; (f) profile plot of raw and LOWESS smoothed Wnt/EGL-20::YPET fluorescence intensity along the anteroposterior axis in the same worm as in (e); (g) maximum intensity projections of a living, mid L1 stage animal showing plasma membranes of egl-20 source cells labeled by Pegl-20>2x mKate2::PH (magenta) and Wnt/EGL-20::mNG protein (green); (h) profile plot of normalized EGL-20::mNG and Pegl-20>2x mKate2::PH fluorescence intensities along the anteroposterior axis illustrating Wnt dispersal from source cells. Images are oriented with anterior to left and dorsal to top. Scale bars = 0.1 mm in a, 10 μm in c and d, and 20 μm in e and g.

Figure 1—source data 1. Positions of Q neuroblast descendants in wild type, egl-20(n585), EGL-20::mNG, and EGL-20::YPET strains.
Source data corresponding to Figure 1b. Positions of Q neuroblast progeny after migration were quantified by using the non-motile URX neuron in the head and PLM neurons in the tail as fiducial markers. Relative positions of Q neuroblast progeny AQR, AVM, PVM, and PQR were calculated as a percentage of the distance between URX and PLM.
DOI: 10.7554/eLife.38325.007
Figure 1—source data 2. Fluorescence intensity values for EGL-20::YPET, EGL-20::mNG, and Pegl-20 > 2 x mKate2::PH.
Source data corresponding to Figure 1f,h. Fluorescence intensity values were obtained in FIJI (Schindelin et al., 2012) by drawing a line the width of the worm from head to tail and using the ‘plot profile’ function. Off-worm background in a nearby region was then subtracted from the raw pixel intensities.
elife-38325-fig1-data2.xlsx (126.3KB, xlsx)
DOI: 10.7554/eLife.38325.008

Figure 1.

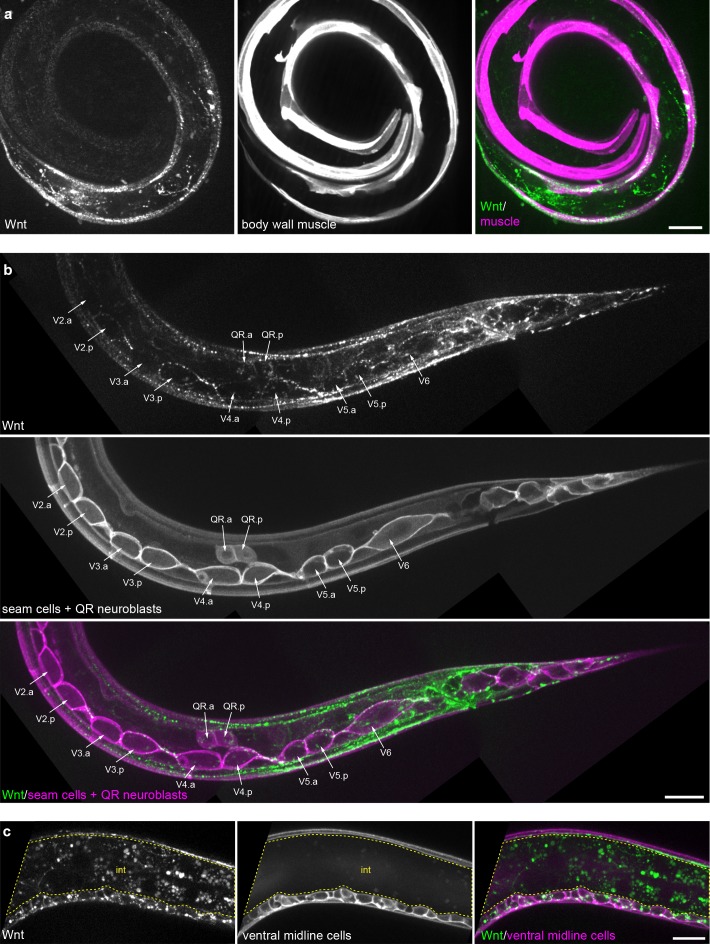
Figure 1—figure supplement 1. Tissue-specific Wnt/EGL-20::mNG localization.

Figure 1—figure supplement 1.

(a) Maximum intensity projection of surface planes in an L1 larva highlighting Wnt/EGL-20::mNG (green) localization to body wall muscles marked by Pmyo-3>mCherry::PH (magenta). (b) Maximum intensity projection of surface planes in an L1 larva highlighting Wnt/EGL-20::mNG localization to plasma membranes of seam cells and migrating QR neuroblasts marked by Pwrt-2>2x mTurq2::PH (magenta). Note that Wnt/EGL-20 is concentrated in posterior daughters of seam cells V2-5. (c) Wnt/EGL-20 localization to ventral midline cells (magenta) in a mid-body region. Area of bright intestinal autofluorescence with 514 nm illumination is outlined. animal in (a) is curled with tail to bottom left and head to inner right. Images in (b) and (c) are oriented with anterior to left and dorsal to top,, scale bars = 10 μm.
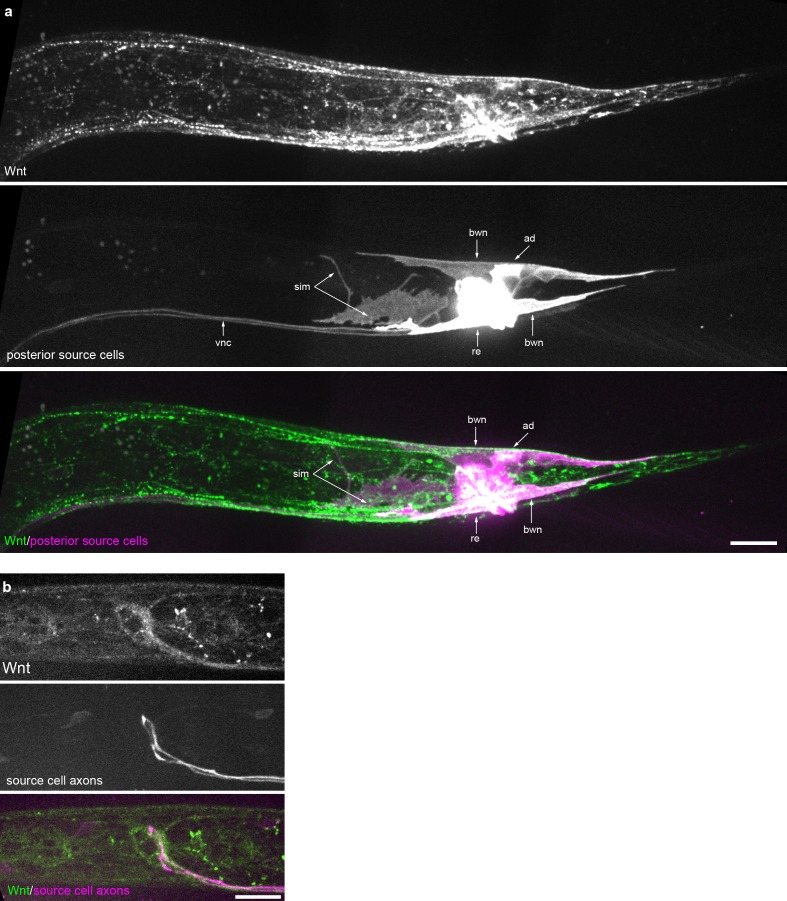
Figure 1—figure supplement 2. Wnt/EGL-20 localization and plasma membrane architectures of source cells.

Figure 1—figure supplement 2.

(a) Maximum intensity projection of surface optical sections in the posterior of an L2 larva showing tagged Wnt (green) and plasma membranes of source cells marked by Pegl-20>2x mKate2::PH (magenta). (b) Maximum intensity projection of midline planes in the head region of an L2 animal highlighting Wnt/EGL-20::mNG localization near axons that encircle the pharynx and originate from posterior source neurons expressing Pegl-20>2x mKate2::PH. Abbreviations: ad, anal depressor muscles; bwn, body wall muscle; re, rectal epithelial cells; sim, stomatointestinal muscles; vnc, ventral nerve cord. Images are oriented with anterior to left and dorsal to top, scale bars = 10 μm.
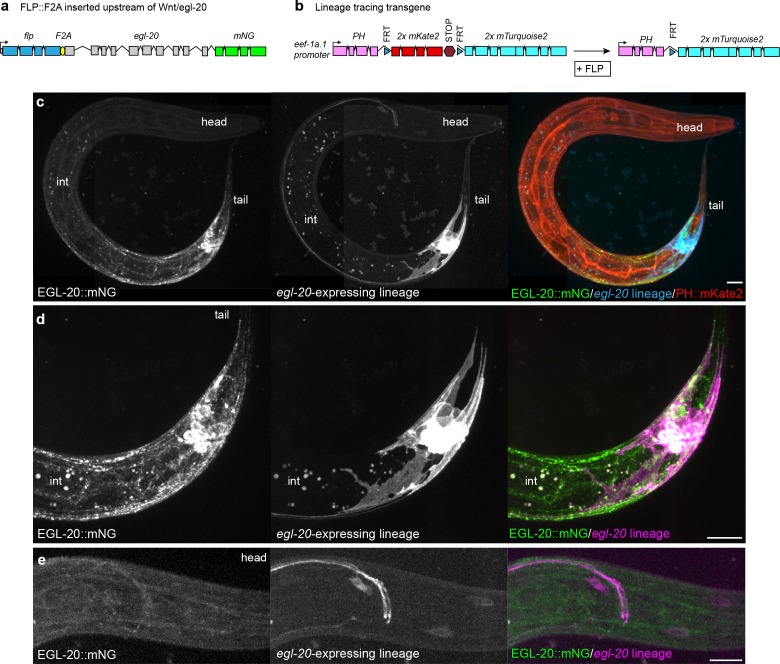
Figure 1—figure supplement 3. Visualization of the native egl-20-expressing cell lineage in vivo.

Figure 1—figure supplement 3.

(a) Design of an endogenously engineered, bicistronic flp::F2A::egl-20::mNG allele to drive FLP-based recombination in cells that natively express egl-20. (b) Design of a cell-lineage reporter based on a ubiquitously expressed Peef-1a.1>PH::FRTmKate2::STOPFRTmTurq2 transgene that converts irreversibly from PH::mKate2 to PH::mTurq2 after excision by FLP. (c–e) maximum intensity projections of EGL-20::mNG, the egl-20-expressing cell lineage marked by PH::mTurq2, and non-excised cells marked by PH::mKate2 in a L2 stage animal. (c) image of entire animal. (d) detailed view of posterior source-cell lineage. (e) detailed view of posterior head showing axons from posterior neurons that project to the nerve ring, along with head neurons. Spots in the mid-body region in (c) and (d) are intestinal autofluorescence from deep optical sections (labeled int). Scale bars = 10 μm.