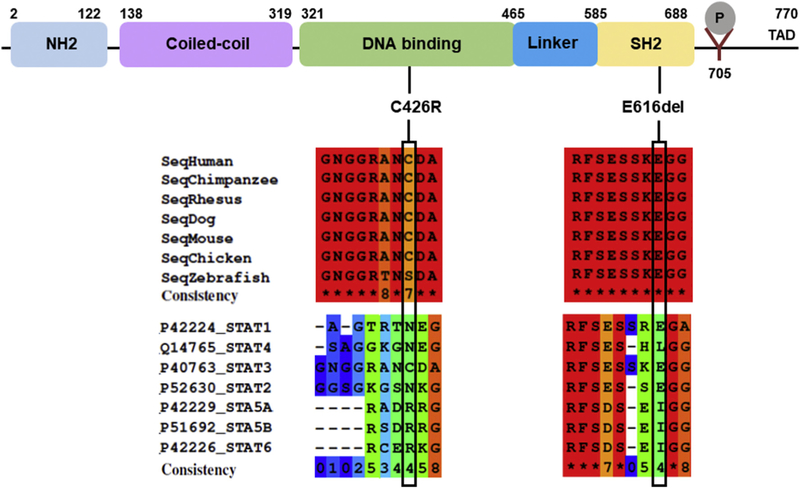
Fig. 1.
Schematics of human STAT3. The position of the two de novo mutations are shown below the STAT3 domains. Multiple sequence alignments among different species and among STAT proteins were done with PRALINE software. The color scheme indicates the least conserved alignment position (dark blue), to the most conserved alignment position (red). (For interpretation of the references to color in this figure legend, the reader is referred to the Web version of this article.)

