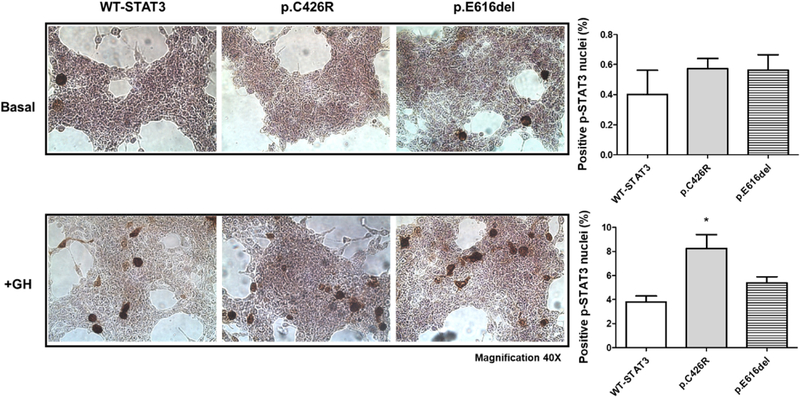
Fig. 5.
HEK293-T cells overexpressing WT-STAT3 and variants were examined immunohistochemically for p-STAT3 (tyr705) detection under unstimulated conditions (upper panels) and after 2 h-GH treatment (200 ng/mL, lower panels). Number of positive p-STAT3 nuclei were normalized to total cells and expressed as Mean ± SEM from at least six random microscopic field images of two independent experiments. Mann-Whitney test (*P < 0.05) was used to compare positive p-STAT3 nuclei between cells expressing STAT3-GOF variants and WT-STAT3. Representative images are shown (Magnification 40 ×).

