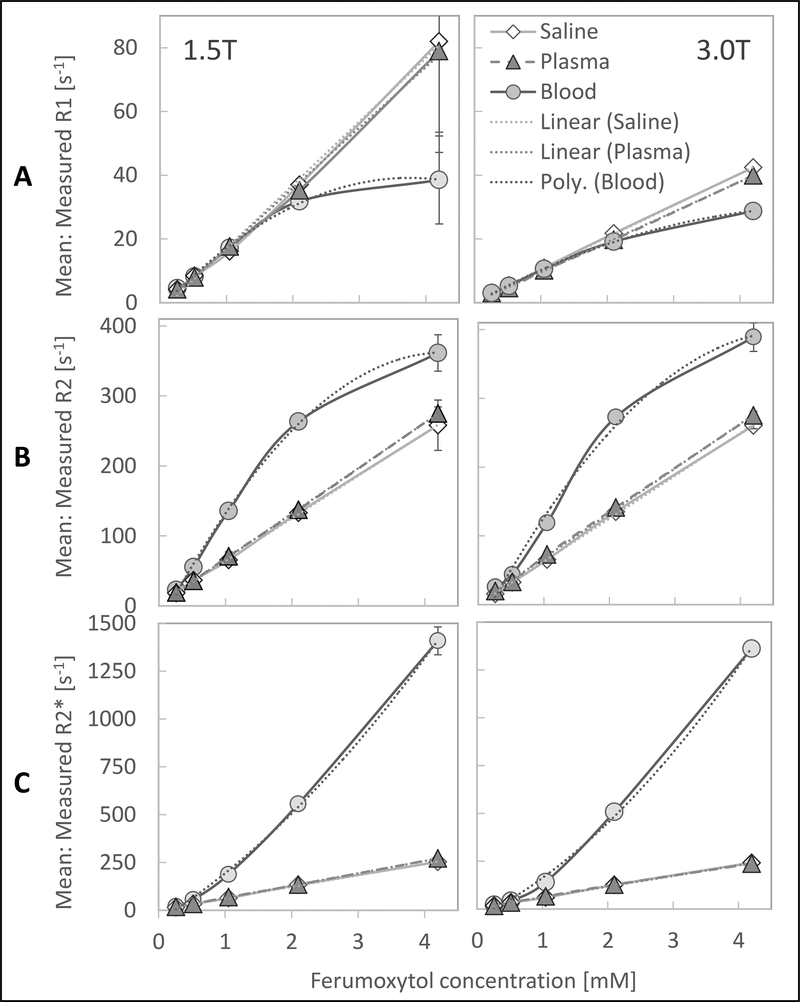
Figure 2:
There is a linear relationship of R1, R2 and R2* in saline and plasma and nonlinear relationship in blood with increasing ferumoxytol concentrations at 1.5T and 3.0T. The plots show (A:) the mean measured longitudinal relaxivity rates, R1, (B:) mean transverse relaxivity rates, R2, and (C:) mean transverse relaxivity rates from free induction decay, R2* with standard deviations (error bars) of different ferumoxytol concentrations in saline, plasma and whole blood at 37°C at 1.5T (left) and 3.0T (right). Note: most error bars are too small to be depicted by the plots.

