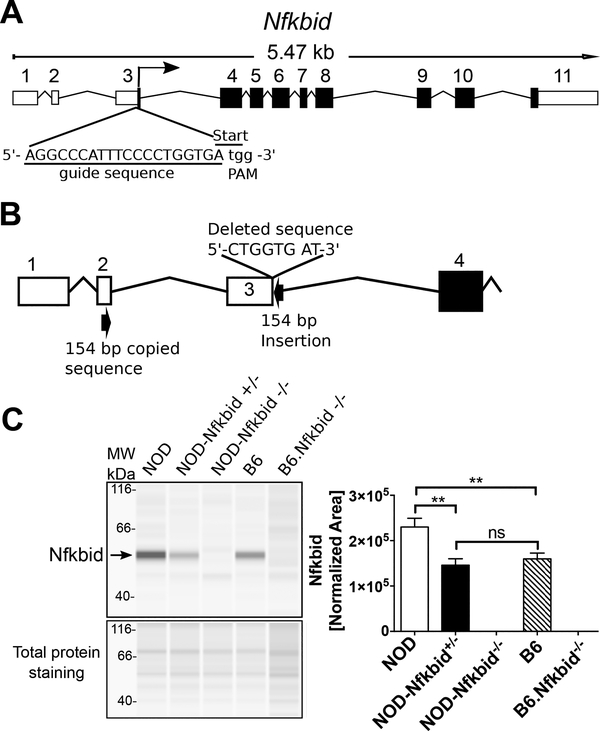
Figure 3: Targeting Nfkbid by CRISPR/Cas9 in NOD mice.
(A) Representation of mouse Nfkbid gene showing the translation start site at the end of exon 3 and the sgRNA (underlined) designed to target this region by CRISPR/Cas9. The PAM sequence is indicated in lower case. (B) Schematic of the resulting targeted mutation consisting of an 8-nucleotide deletion and an insertion of 154 nucleotides originated by copy and inversion of a segment from Nfkbid exon 2 (For more detail, see Supplementary Figure 1). (C) Nfkbid protein abundance was assessed in total thymus lysates from the indicated strains by Simple Wes automated western blot analysis. B6.Nfkbid−/− thymus samples were provided by Dr. Ingo Schmitz. Nfkbid was detected as a 55 kDa band. The difference in molecular weight compared to the theoretical 35 kDa, could be due to posttranslational modifications. Lower panel indicates the corresponding total protein staining for each sample. Right panel shows the Nfkbid-normalized area for NOD (n=6), NOD-Nfkbid+/− (n=9), NOD-Nfkbid−/− (n=8), B6 (n=6), and B6.Nfkbid−/− (n=4) thymus samples. Nfkbid-peak area was normalized as follows: . Bars represent the mean ± SEM. ns p>0.05, ** p<0.01, Mann-Whitney analysis.

