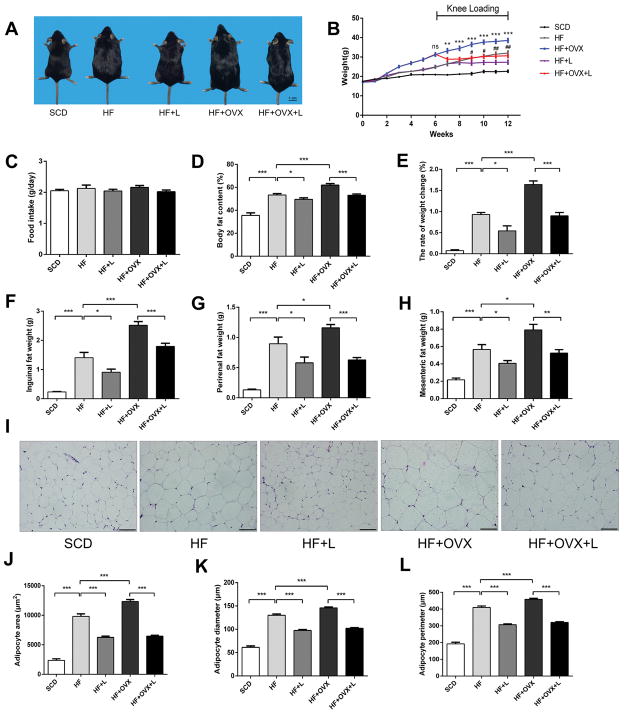
Figure 2. Reduction in body weight and fat mass in obese mice by knee loading.
A) Whole body images. B) Changes in body weight. C) Food intake per day among the five groups. D) Whole body fat content. E) Rate of weight changes. F) Inguinal fat pat weight. G) Perirenal fat pat weight. H) Mesenteric fat weight. I) Representative HE stained periuterine adipose tissue (magnification 200×; and scale bar=100μm). J-K) Measurement of periuterine adipocyte area, diameter, and perimeter. All values were expressed as mean±SEM (n=10 mice per group). Of note, #indicates P<0.05 compared with HF+L, *was used as comparison with HF+OVX+L. The asterisks (*, ** and ***) and pound signs (#, ##, and ###) represent P<0.05, P<0.01, and P<0.001, respectively, and “ns” indicates P>0.05.

