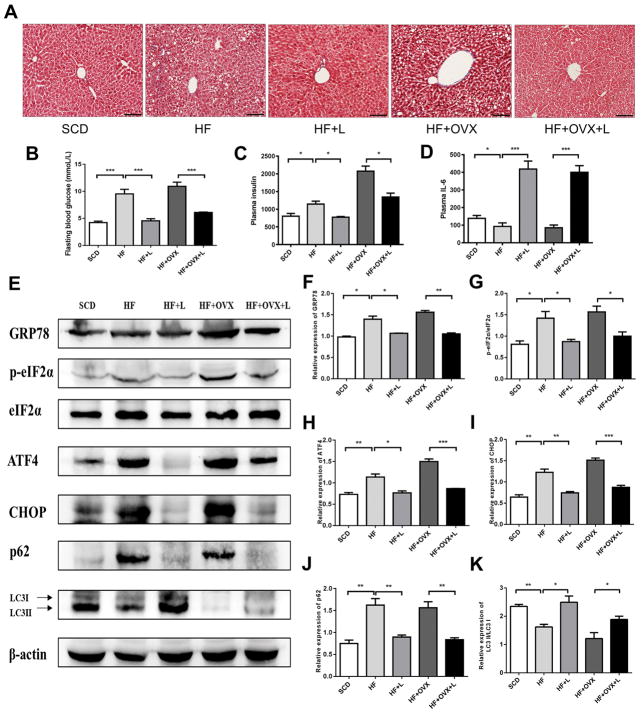
Figure 4. Knee loading-driven inhibition of ER stress and regulation of autophagy in the livers.
A) Masson trichrome stained sections of liver tissue (magnification 200×; and scale bar=100 μm). B) Plasma fasting blood glucose levels. C) Plasma insulin levels. D) Plasma IL-6 levels. E) Representative images of Western blotting in the five groups (n=3 mice per group), for the selected genes involved in the ER stress and autophagy. F-K) Quantified levels of GRP78, p-eIF2α, ATF4, CHOP, p62, LC3II/I. The asterisks (* and **) represent P<0.05, and P<0.01, respectively.

