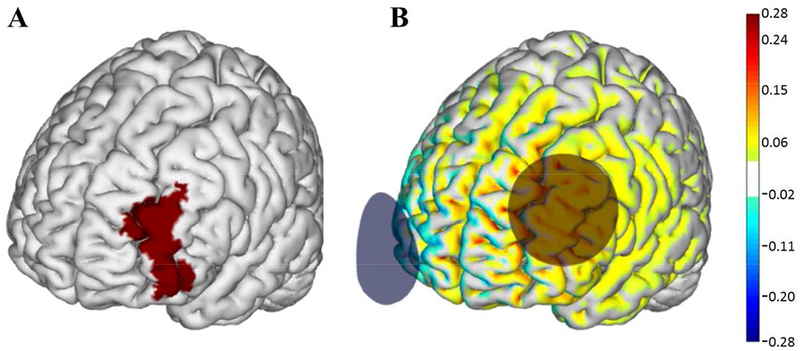
Figure 2: tDCS electrode placement and electrical current flow model.

A) The left dorsolateral prefrontal cortex (dlPFC) (Brodmann Area 46) highlighted in red. B) Active tDCS was delivered at a maximum intensity of 2.0 mA with the anode (red circle) placed over the F3 region and the cathode (blue circle) over the Fp2 region according to the 10–20 EEG placement system. Warmer and cooler colors depict the normal component of the electrical field produced by this stimulation, modeled on a standard brain as described in Miranda et al (2013)50. Images courtesy of Neuroelectrics.
