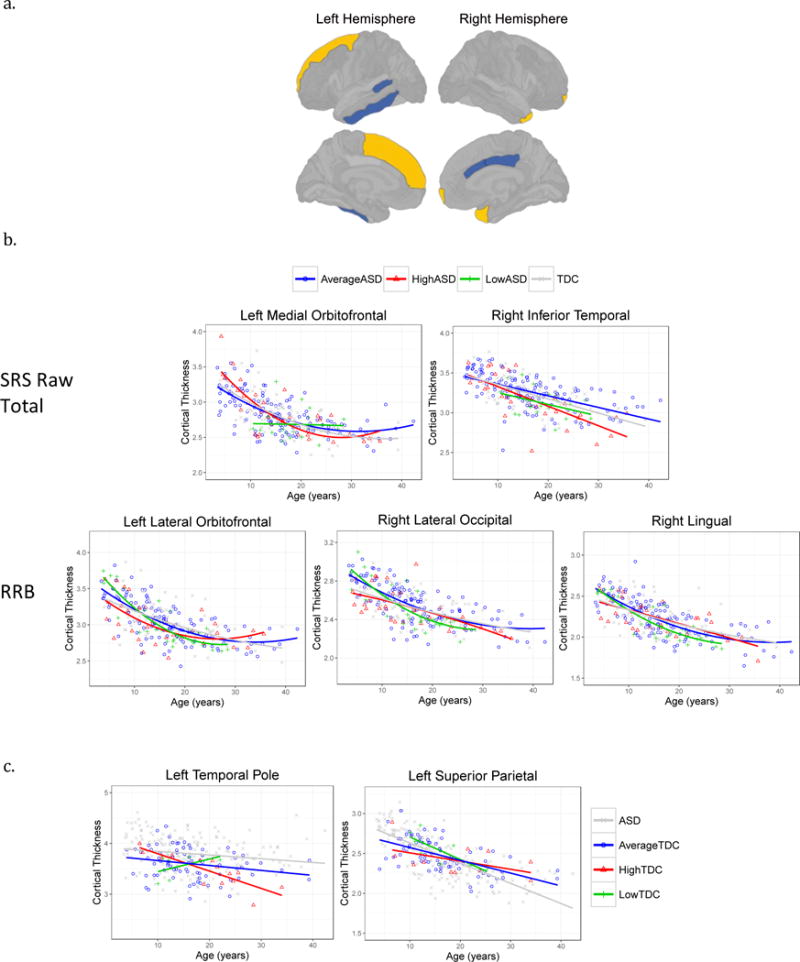
Figure 2.

Regional cortical thickness associated with total raw SRS score, SCI and RRB domains.
2a. In the ASD group, higher SRS scores were associated with regions of thicker (light color) or thinner cortex (dark color). Higher scores were associated with thicker right frontal and temporal poles, and left superior frontal. Higher scores were associated with thinner left inferior temporal and bank of the superior temporal sulcus, and right caudal anterior and posterior cingulate.
2b. Scatterplots of cortical regions with significant SRS total score by age interactions in ASD. To visualization the interactions, individual participants and group fit lines are labeled according to ASD SRS subgroups: Average (within 1SD of ASD group mean), High (>1SD of group mean), Low (<1SD of group mean).
2c. Visualization of significant SRS score by age interactions in the TDC group only according to TDC SRS subgroups: Average (within 1 SD of TDC mean), High (>1SD of group mean), Low (<1SD of group mean).
