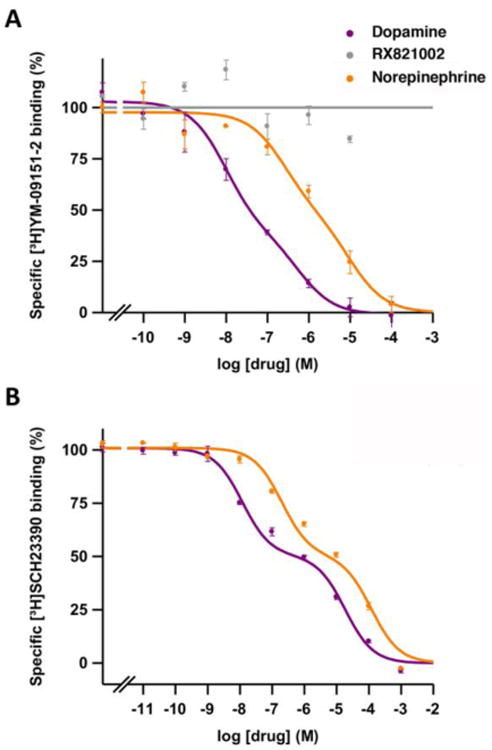
Figure 1. Radioligand binding to D2-like and D1-like receptors in brain striatum.

Representative competition curves of D2-like receptor antagonist [3H]-YM-09151-2 vs. increasing concentrations of free competitors NE, DA and RX821002 (A) and of D1-like receptor antagonist [3H] SCH23390 vs. increasing concentrations of DA and NE (B) in sheep brain striatum. Values are expressed as a percentage of the specific binding (100% is 0.13 ± 0.01 pmol/mg protein in A and 0.43 ± 0.04 pmol/mg protein in B). Experimental data were fitted to the two-state dimer receptor model equations, as described in the Materials and Methods section. Values are mean ± S.E.M. from a representative experiment (n = 3-5) performed in triplicate.
