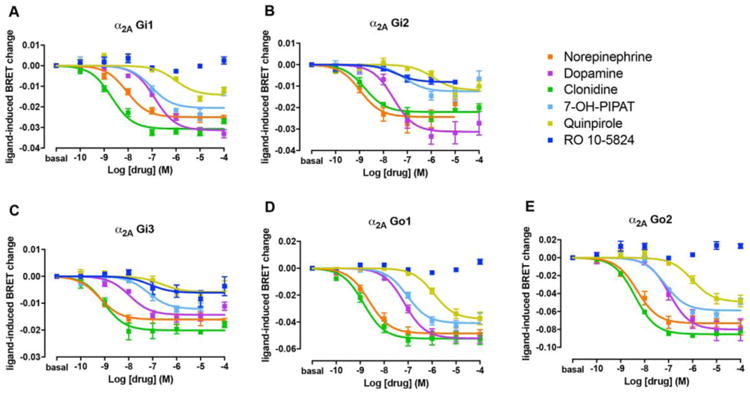
Figure 3. G protein activation of α2A by dopaminergic and adrenergic ligands.

Concentration-response experiments of G protein activation by NE, DA, clonidine and D2-like receptor ligands mediated by α2A in HEK-293T cells transiently transfected with α2A adrenoceptor, the G protein subunits Gαi1-RLuc (A), Gαi2-RLuc (B), Gαi3-RLuc (C), Gαo1-Rluc (D) or Gαo2-RLuc (E), γ2-mVenus and non-fused β1. Cells were treated with Coelenterazine H followed by increasing concentrations of one of the ligands. Ligand-induced changes in BRET values were measured as described in the Materials and Methods section. BRET values in the absence of ligands were subtracted from the BRET values for each agonist concentration. Data were adjusted to a sigmoidal concentration-response function by nonlinear regression analysis and represent means ± S.E.M. of 3 to 11 experiments performed in triplicate (see Table 1 and 2 for EC50 and Emax values and statistical analysis).
