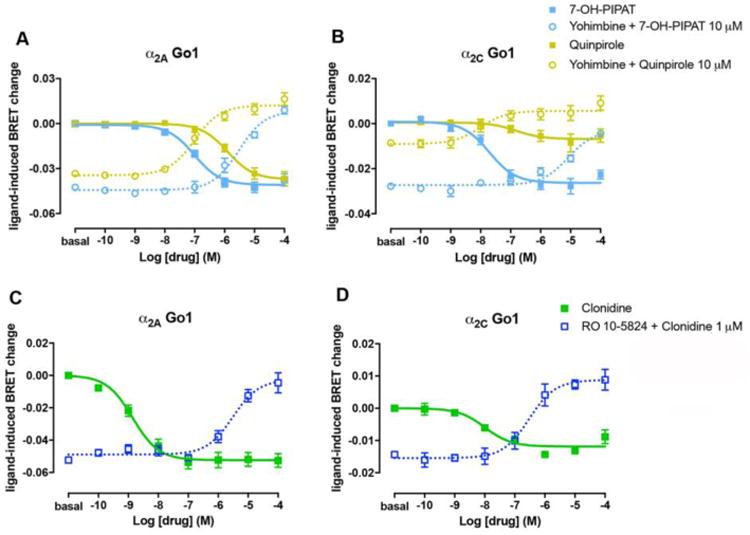
Figure 5. Specificity of the effect of dopaminergic ligands on α2A and α2C adrenoceptors.

(A, B) Dose-dependent inhibition by increasing concentrations of the non-selective α2 receptor antagonist yohimbine of Gαo1 protein activation induced by 10 μM of the D2-like receptor agonists 7-OH-PIPAT (dotted blue) or 10 μM of quinpirole (dotted yellow) in HEK-293T cells transfected with α2A (A) or α2C (B) adrenoceptors, Gαo1-RLuc, γ2-mVenus and non-fused β1. As controls, concentration-response curves of Gαo1 protein activation by 7-OH-PIPAT (full blue) or quinpirole (full yellow) from Fig. 3D and Fig. 4D are showed. Cells were treated with Coelenterazine H followed by the addition of 7-OH-PIPAT or quinpirole. Ligand-induced changes in BRET values were measured as described in the Materials and Methods section. (C, D) Dose-dependent inhibition of the agonistic effect of clonidine at 1 μM by increasing concentrations of RO-105824 (dark blue) in cells transfected with α2A (C) or α2C (D) adrenoceptors, Gαo1-RLuc, γ2-mVenus and non-fused β1. As controls, concentration-response curves of Gαo1 protein activation by clonidine (full green) from Fig. 3D and Fig. 4D are showed. Data were adjusted to a sigmoidal concentration-response function by nonlinear regression analysis and represent means ± S.E.M. of 3 to 6 experiments performed in triplicate.
