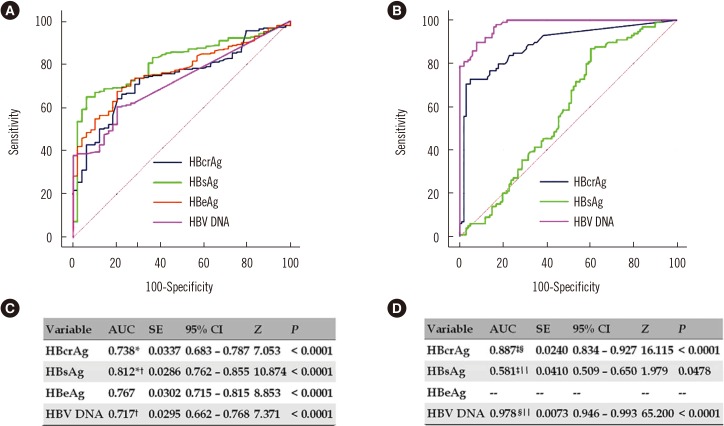
Fig. 2. ROC curves and AUCs of serum virological markers for predicting EPCH and ENCH. (A) ROC curves for predicting EPCH. (B) ROC curves for predicting ENCH. (C) AUCs for predicting EPCH. (D) AUCs for predicting ENCH.
*Z=2.072; P=0.0383; †Z=3.115; P=0.0018; ‡Z=7.168; P<0.0001; §Z=4.128; P<0.0001; ∥Z=9.837; P<0.0001.
Abbreviations: HBcrAg, hepatitis B core-related antigen; HBsAg, hepatitis B surface antigen; HBeAg, hepatitis B e antigen; HBV DNA, hepatitis B virus DNA; AUC, area under ROC curve; SE, standard error; 95%CI, 95% confidence interval; EPCH, HBeAg-positive chronic hepatitis; ENCH, HBeAg-negative chronic hepatitis.

