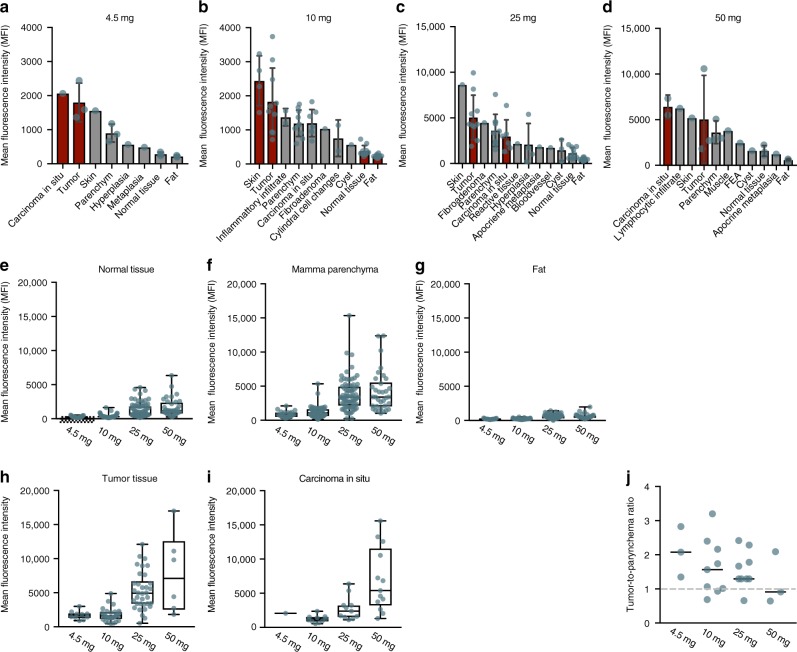
Fig. 4.
Micro-segmentation per dose group, and per tissue type. Per dose group we plotted mean fluorescence intensity per tissue type (a–d); tumor and carcinoma in situ components shown in red. The mean fluorescence intensity per tissue type was plotted in e-i. In j the tumor-to-parenchyma ratio per dose group is plotted. Bars represent the mean and the error bars the standard deviation. Boxplot centerline is at median, the bounds of the box at 25th to 75th percentiles, the whiskers are depicting the min–max

