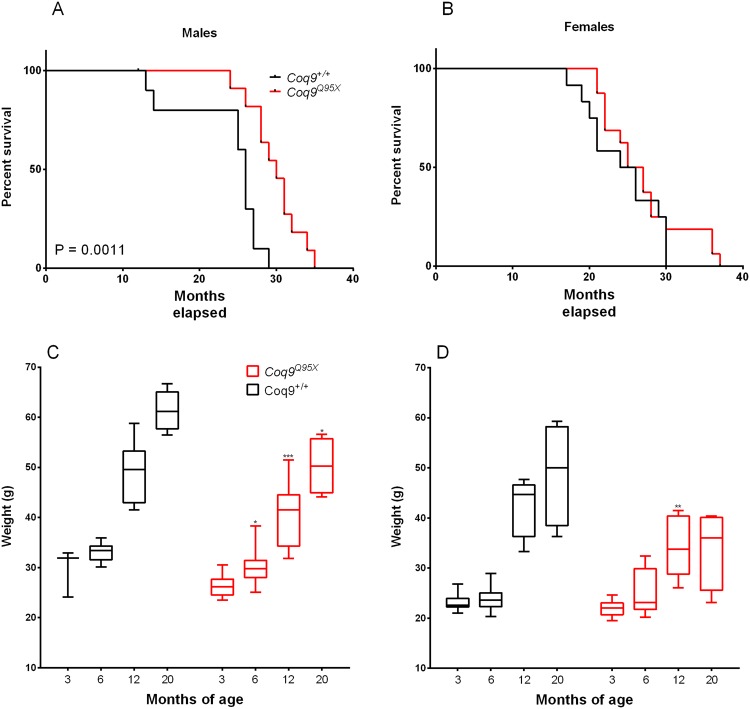
Figure 1.
Animal Survival and body weight. (A,B) Kaplan-Meier survival curves of Coq9Q95X and Coq9+/+ male and female mice, respectively, with p values calculated by the log-rank (Mantel-Cox) test and the Gehan-Breslow-Wilcoxon test. For the survival analysis, 23 Coq9+/+ mice (11 males and 12 females) and 26 Coq9R239X mice (11 males and 16 females) were used. (C,D) Animal body weights of Coq9Q95X and Coq9+/+ male and female mice, respectively. At each age, 5–13 animals were used in each sex. The graphs represent box & whisker plots that show a “box” with up edge at Q1, bottom edge at Q3, the “middle” of the box at Q2 (the median) and the maximum and minimum as “whiskers”.

