
Figure 1.
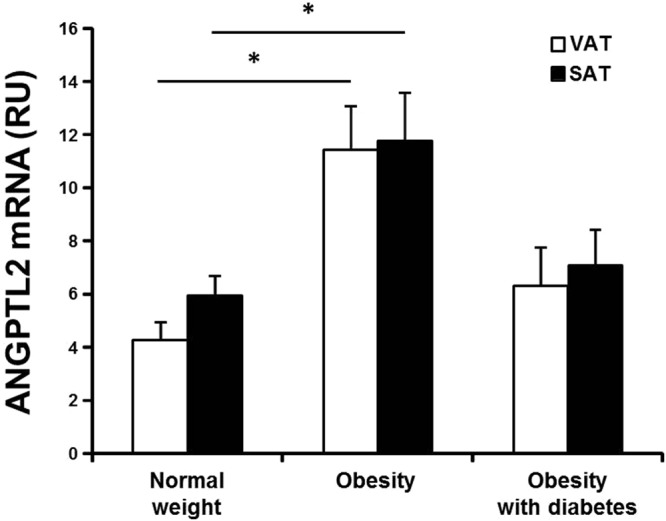
ANGPTL2 mRNA expression in human adipose tissues. ANGPTL2 mRNA in the VAT and SAT of the normal-weight control (n = 32), non-diabetic obesity (n = 31), and obesity with type 2 diabetes (n = 14) groups. β-actin was used as the reference gene; ANGPTL2 mRNA levels are presented in relative units (RU). Data are log-transformed for statistical analysis and shown as the mean ± SE on the original (back-transformed) scale. *p < 0.05 vs. the corresponding fat depot in the control group by ANOVA with Tukey’s test.