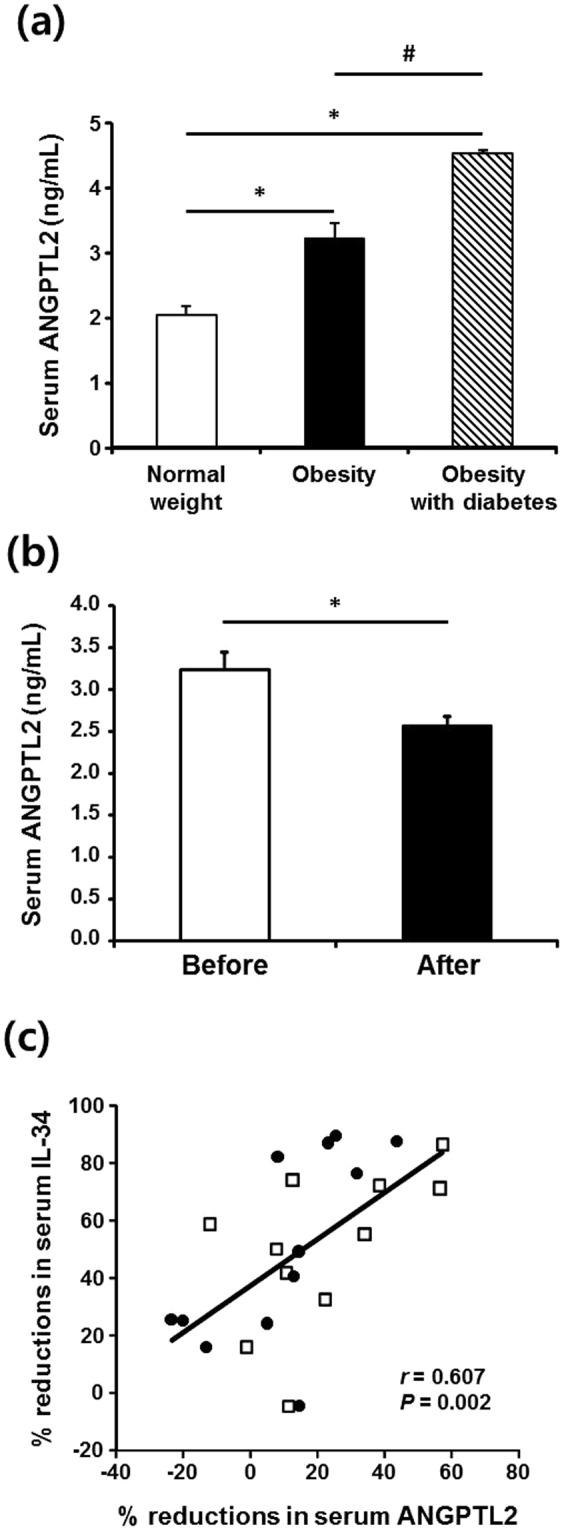
Figure 3.

Serum ANGPTL2 concentrations and ANGPTL2 mRNA expression in human. (a) Serum ANGPTL2 concentrations in patients with obesity (n = 31), obesity and type 2 diabetes (n = 14), and normal-weight control patients (n = 32). Data are log-transformed for statistical analysis and shown as the mean ± SE on the original (back-transformed) scale. *p < 0.01 vs. control, #p < 0.01 vs. obesity group according to ANOVA and the Tukey’s test. (b) Significant reduction in serum ANGPTL2 concentration following RYGB surgery in obese patients. Serum ANGPTL2 concentration and metabolic parameters were measured before and 5–9 months (average 7.3 months) after surgery in a subgroup of obese patients (n = 23). *p < 0.01 vs. before surgery according to paired t-test. (c) Close association between percentage reduction in serum ANGPTL2 concentrations and percentage reduction in serum IL-34 following the surgery. Percent reduction in serum ANGPTL2 was calculated as [(serum ANGPTL2 before surgery – serum ANGPTL2 after surgery) ÷ serum ANGPTL2 before surgery] × 100. The correlation coefficient (r) between changes in measurements was calculated using Spearman’s correlation.
