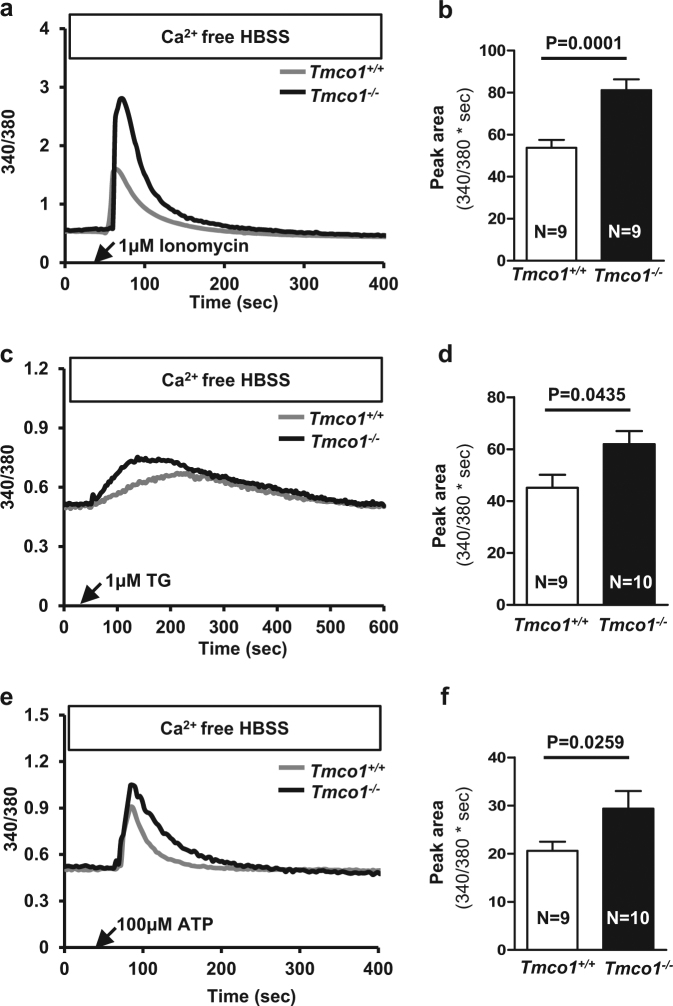
Fig. 4.
Tmco1 ablation results in abnormal Ca2+ signaling and ER Ca2+ overload in GCs. Black arrows indicated the time of treatment. a Ionomycin (1 μm)-evoked Ca2+ transients in primary GCs in Ca2+-free medium. b Histogram of the average peak area of ionomycin-evoked Ca2+ transients in GCs. c TG (1 μm)-triggered Ca2+ signaling in GCs. d Bar chart presented the average of peak area of TG-induced Ca2+ transients. e Representative curves of ATP (100 μm)-stimulated Ca2+ response. f Summarized bar graph depicted much more elevation of Ca2+ mobilization induced by ATP in KO GCs

