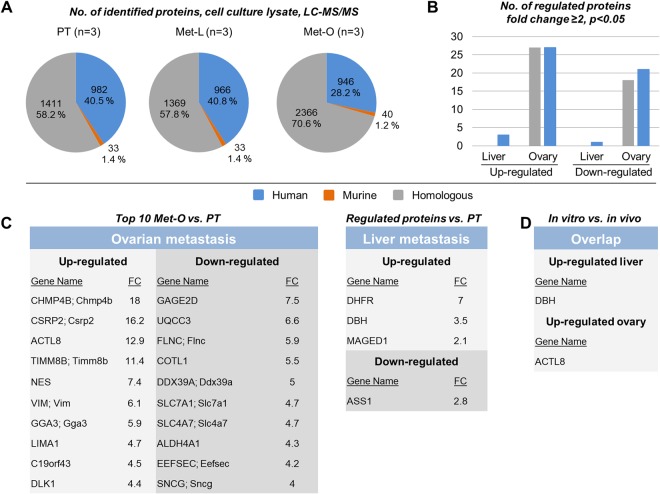
Figure 5.
Differential proteome analysis of cultured cells. (A) Total number of human, murine and homologous proteins identified by proteome analysis of lysates of cultured cells of primary tumor (PT), liver metastasis (Met-L) and ovarian metastasis (Met-O) sublines. (B) Number of proteins found to be regulated at the different sites. The embedded tables in (C) display the gene names of proteins found to be up- or down-regulated at both sites (top 10 in the case of Met-O cells, all proteins in the case of Met-L cells). The table in (D) shows gene names of proteins that were regulated in both the IR-laser ablated tissue homogenates of in vivo specimens and cell lysates of in vitro sublines.

