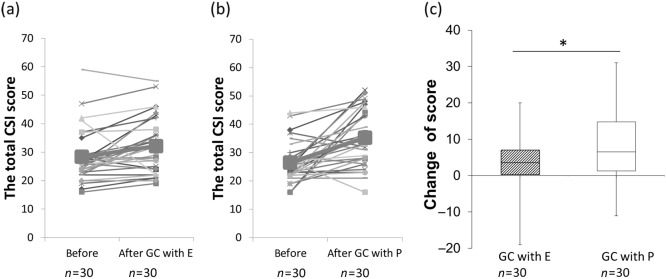
Fig. 2. The effects of addministration of enzyme mixture or placebo to the change in total CSI score by gluten challenge.
a, b The total CSI score before (Fig. 1, V5 or V7) and after (Fig. 1, V6 or V8) gluten challenge (GC) with enzyme mixture (E; (a)) or placebo (P; (b)). Thick lines and the largest symbols indicate average data. c The change in total CSI score from after washout with gluten-free diet for 2 weeks (Fig. 1, V5 or V7) to after gluten challenge with the enzyme mixture or dextrin as placebo for 2 weeks (Fig. 1, V6 or V8). Box with hatch marks indicates enzyme administration (GC with E, gluten challenge with enzyme mixture). White box indicates placebo (GC with P, gluten challenge with placebo). *p < 0.05

