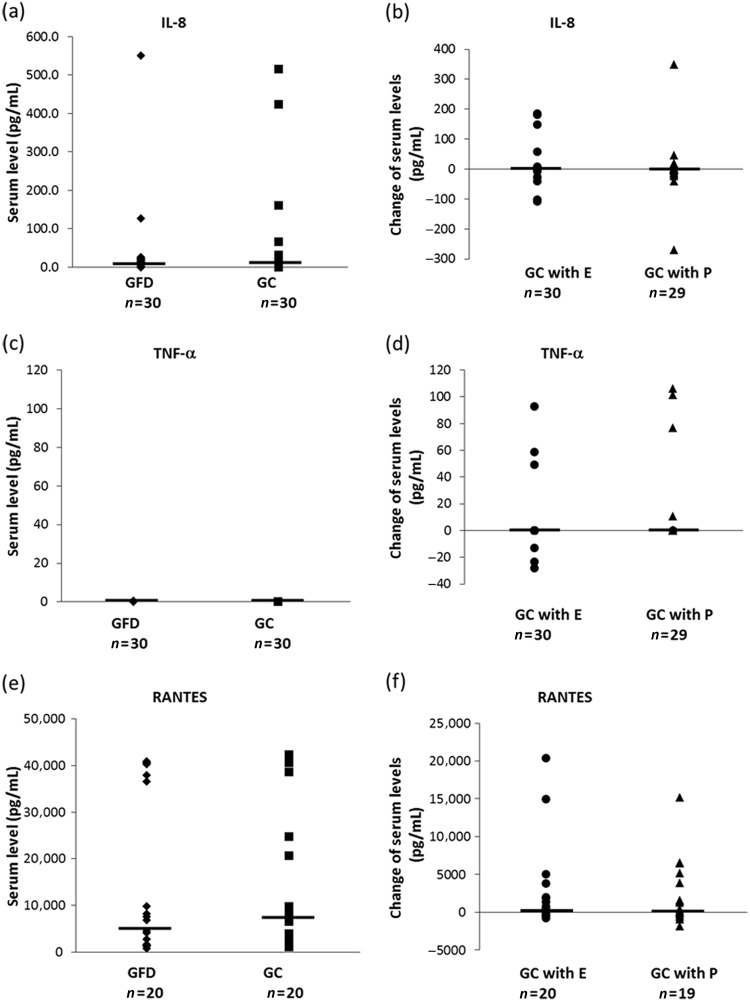
Fig. 4. The serum levels of inflammatory markers during this clinical study.
The serum levels of IL-8, TNF-α, and RANTES under the condition of the gluten-free diet (Fig. 1, V3) or gluten challenge (Fig. 1, V4) are shown in a, c, and e. The changes in serum levels of IL-8, TNF-α, and RANTES from after washout with gluten-free (Figure1, V3, V5 or V7) to after gluten challenge, gluten challenge with the enzyme mixture, or gluten challenge with dextrin as placebo (Figure1, V4, V6 or V8) are shown in b, d, and f. No significant difference was detected in each component by statistical analysis performed by paired t-test. ◆GFD gluten free diet, ■GC gluten challenge, ●GC with E gluten challenge with the enzyme mixture, ▲GC with P gluten challenge with placebo. Horizontal bars are median values

