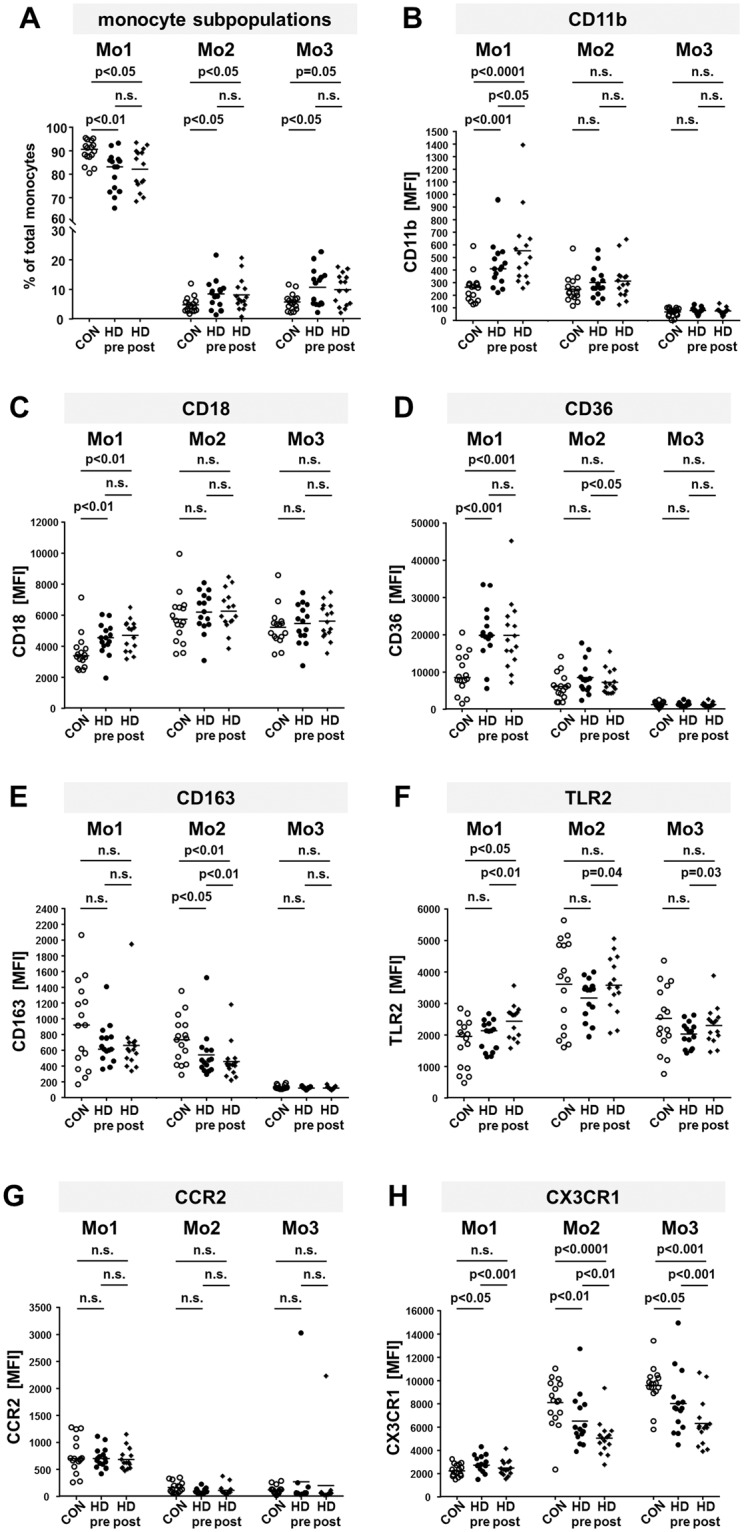
Figure 1.

Comparison of percentages of monocyte subpopulations and expression of surface markers on monocytes from healthy donors and dialysis patients. Blood from healthy donors (CON) and hemodialysis patients (HD) before (pre) and after (post) a dialysis session was stained with fluorochrome labeled antibodies to gate for monocyte subsets as outlined in supplementary Fig. 1. The scatter plots show the percentages of Mo1, Mo2 and Mo3 of total monocytes (A), the expression of CD11b (B), CD18 (C), CD36 (D), CD163 (E), TLR2 (F), CCR2 (G) and CX3CR1 (H) from 16 healthy controls (blank circles) and 15 HD patients before (HD pre, black circles) and after (HD post, black diamonds) a dialysis session. P-values comparing CON with HD pre or HD post were calculated with Mann-Whitney U-test, p-values comparing HD pre and HD post with Wilcoxon matched-pairs signed rank test. MFI: median fluorescence intensity. n.s.: not significant.
