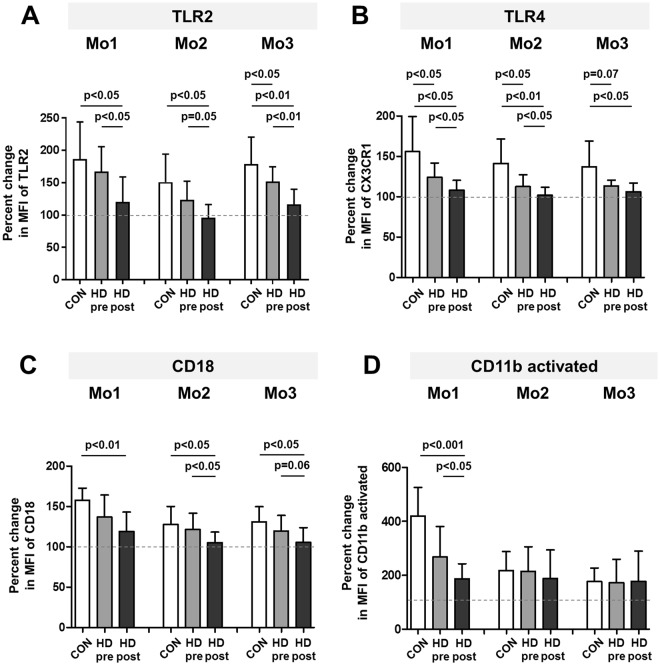
Figure 6.
Response of healthy controls’ or HD patients’ monocytes upon LPS stimulation Whole blood from healthy donors (CON, n = 7) and HD patients (HD, n = 9, collected both before, pre, and after, post, a single dialysis session) was incubated for 30 min with 10 ng/ml LPS or left untreated. The graphs show the percentual change of TLR2 (A), TLR4 (B), CD18 (C) or CD11b activated (D) expression on all three monocyte subpopulations in healthy volunteers (white bars), or HD patients before (grey bars) and after (black bars) a single dialysis session. P-values comparing CON with HD pre or HD post were calculated with two-tailed Mann-Whitney U-test, p-values comparing HD pre and HD post with Wilcoxon matched-pairs signed rank test. MFI: median fluorescence intensity.

