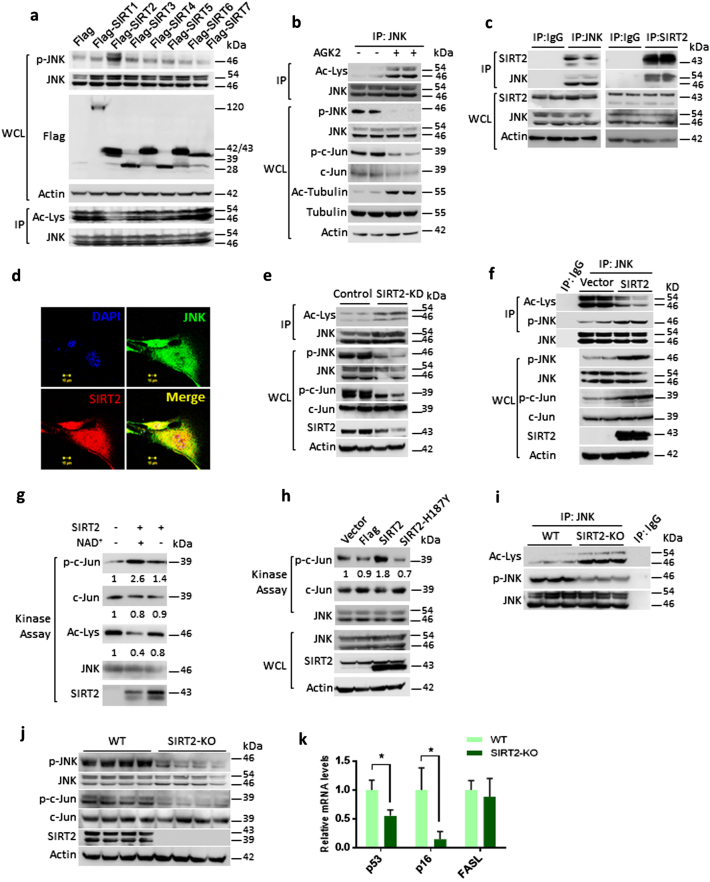
Fig. 2.
SIRT2 deacetylase regulates the acetylation of JNK. a Western blotting analysis showing acetylation and phosphorylation of JNK in HeLa cells overexpressing the Sirtuin isoforms, SIRT1–SIRT7. Cells were transiently overexpressed with either Flag- or Flag- SIRT1-7, and phosphorylation of JNK was analysed by western blotting. JNK was immunoprecipitated from these overexpressed lysates and tested for its acetylation by western blotting. Whole-cell lysates (WCLs) were probed with Flag-antibody for detecting the expression of Sirtuins. b Western blotting analysis showing the phosphorylation, acetylation and activity of JNK in HeLa cells treated with vehicle or SIRT2 inhibitor, 10 µM AGK2 for 6 h. The activity of AGK2 was tested by probing the acetylation status of tubulin with specific antibody detecting the acetyl-tubulin. JNK was immunoprecipitated from the WCLs and probed for Ac-Lys antibody. The phosphorylation of JNK was tested by western blotting. The activity of JNK was tested by detecting the phosphorylation of c-Jun with specific antibody. c Endogenous JNK or SIRT2 was immunoprecipitated and probed for its interaction with SIRT2 or JNK respectively, by western blotting. IgG was used as negative control. WCLs were probed for the presence of JNK and SIRT2 by western blotting. Actin was used as a loading control. d Co-localization of JNK (green) with SIRT2 (red), as determined by confocal microscopy. Endogenous JNK and SIRT2 were stained using specific antibodies. The merged image shows yellow colour, indicating the co-localization of JNK and SIRT2, both in the cytoplasm and the nucleus. Scale bar = 10 µM. e Western blotting analysis showing acetylation, phosphorylation and activity of JNK in cells expressing scramble shRNA (control) or SIRT2 shRNA (SIRT2-KD). WCLs were probed for the depletion of SIRT2 by western blotting. JNK was immunoprecipitated and probed with Ac-Lys antibody to detect the acetylation. JNK activity was measured by detecting the phosphorylation of c-Jun by western blotting. Phosphorylation of JNK was detected with the use of a specific antibody. f Western blotting images depicting acetylation, phosphorylation and activity of JNK in HeLa cells overexpressing either control vector or SIRT2. WCLs were probed for the overexpression of SIRT2 by western blotting. JNK was immunoprecipitated and probed with Ac-Lys antibody to detect the acetylation. JNK activity was measured by detecting the phosphorylation of c-Jun by western blotting. The phosphorylation of JNK was detected by a specific antibody. g Representative western blotting images showing in vitro kinase assay for recombinant acetylated and deacetylated JNK1. Endogenously acetylated JNK1 was incubated with SIRT2 in the presence and absence of NAD+ in a test tube for deacetylation. Then the enzymatic activity of acetylated and deacetylated JNK1 against the c-Jun-fusion protein, which contains the JNK-specific phosphorylation site. n = 3 independent experiments. h Representative western blotting images depicting in vitro kinase assay for endogenous JNK immunoprecipitated from HeLa cells overexpressing either control vector, Flag, SIRT2 or SIRT2-H187Y. Immunoprecipitated JNK was incubated with c-Jun fusion protein to assess the enzymatic activity and the phosphorylation of c-Jun was analysed by western blotting. WCLs were probed for the overexpression of SIRT2 and endogenous JNK levels by western blotting. i Representative western blotting analysis showing acetylation and phosphorylation of JNK immunoprecipitated from wild-type (WT) and SIRT2-deficient (SIRT2-KO) mice. Liver tissue lysate of WT and SIRT2-KO mice was analysed for acetylation and phosphorylation of JNK by western blotting. n = 5 mice per group. j Representative western blotting images showing phosphorylation and activity of JNK in liver lysates of WT and SIRT2-KO mice. Tissue lysates of WT and SIRT2-KO mice was analysed for phosphorylation of JNK and SIRT2 levels. JNK activity was measured by detecting the phosphorylation of c-Jun. Actin was used as a loading control. n = 8 mice per group. k Graph depicting the relative mRNA expression levels of AP-1 target genes, p53, p16 and FasL in WT and SIRT2-KO mice, as measured by real-time qPCR analysis. n = 3–4 mice per group. Data are presented as mean ± s.d. *p < 0.05. Student’s t-test was used to calculate the p-values

