Fig. 6.
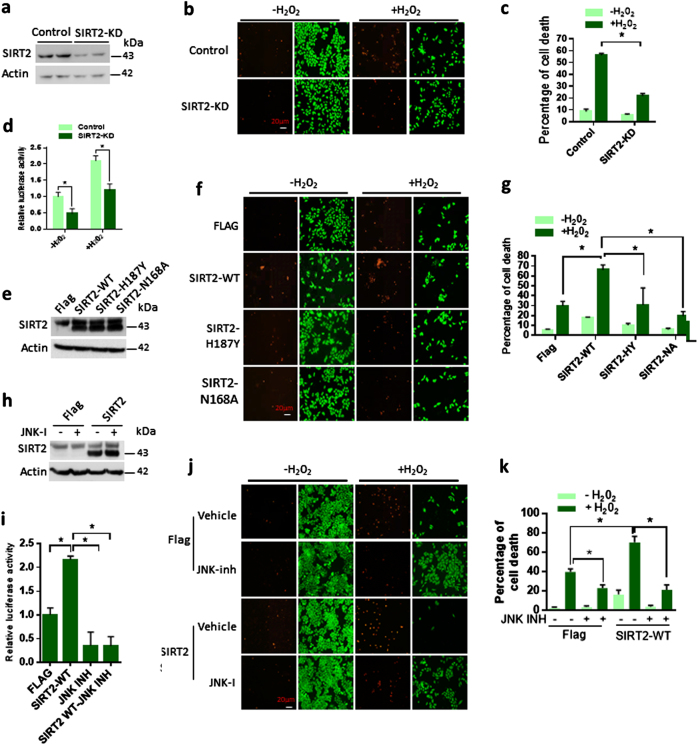
SIRT2-dependent deacetylation of JNK regulates H2O2-induced cell death in HeLa cells. a Western blotting analysis showing the SIRT2 levels in scramble (control) or SIRT2-depleted (SIRT2-KD) HeLa cells. b Representative fluorescent microscopic images depicting the H2O2-induced cell death in control (scramble) or SIRT2-depleted (SIRT2-KD) HeLa cells. Live (green) and dead (red) were stained after 200 µM H2O2 treatment for 12 h. c Graph showing the percentage of H2O2-induced cell death in control (scramble) or SIRT2-depleted (SIRT2-KD) HeLa cells as measured by the staining for live (Green) and dead (red) cells after 200 µM H2O2 treatment for 12 h. n = 3 independent experiments. Data are presented as mean ± s.d. *p < 0.05. Two-way ANOVA was used to calculate the p-values. d Graph showing luciferase reporter assay to analyse JNK activity in control (scramble) or SIRT2-depleted (SIRT2-KD) HeLa cells treated with 200 µM H2O2. Reporter plasmid containing multiple binding sites for AP-1 was used to track the activity of JNK in HeLa cells. n = 3 independent experiments. Data are presented as mean ± s.d. *p < 0.05. Two-way ANOVA was used to calculate the p-values. e Western blotting analysis showing the SIRT2 levels in HeLa cells overexpressing either Flag, wild-type and mutant versions of SIRT2. f Representative fluorescent microscopic images depicting the H2O2-induced cell death in HeLa cells overexpressing either Flag, wild-type and mutant versions of SIRT2. Live (green) and dead (red) were stained after 200 µM H2O2 treatment for 12 h. g Graph showing the percentage of H2O2-induced cell death in HeLa cells overexpressing either Flag, wild-type and mutant versions of SIRT2, as measured by the staining for live (Green) and dead (red) cells after 200 µM H2O2 treatment for 12 h. n = 3 independent experiments. Data are presented as mean ± s.d. *p < 0.05. Two-way ANOVA was used to calculate the p-values. h Western blotting analysis showing the SIRT2 levels in Flag or wild-type SIRT2 overexpressing HeLa cells treated with JNK inhibitor (JNK-I). i Graph showing luciferase reporter assay to analyse JNK activity in Flag or wild-type SIRT2 overexpressing HeLa cells treated with JNK inhibitor (JNK-I). Reporter plasmid containing multiple binding sites for AP-1 was used to assess the activity of JNK in HeLa cells. n = 3 independent experiments. Data are presented as mean ± s.d. *p < 0.05. One-way ANOVA was used to calculate the p-values. j Representative fluorescent microscopic images depicting the H2O2-induced cell death in Flag or wild-type SIRT2 overexpressing HeLa cells treated with JNK inhibitor (JNK-I). Live (green) and dead (red) were stained after 200 µM H2O2 treatment for 12 h. k Graph showing the percentage of H2O2-induced cell death in Flag or wild-type SIRT2 overexpressing HeLa cells treated with JNK inhibitor (JNK-I), as measured by the staining for live (Green) and dead (red) cells after 200 µM H2O2 treatment for 12 h. n = 3 independent experiments. Data are presented as mean ± s.d. *p < 0.05. Two-way ANOVA was used to calculate the p-values

