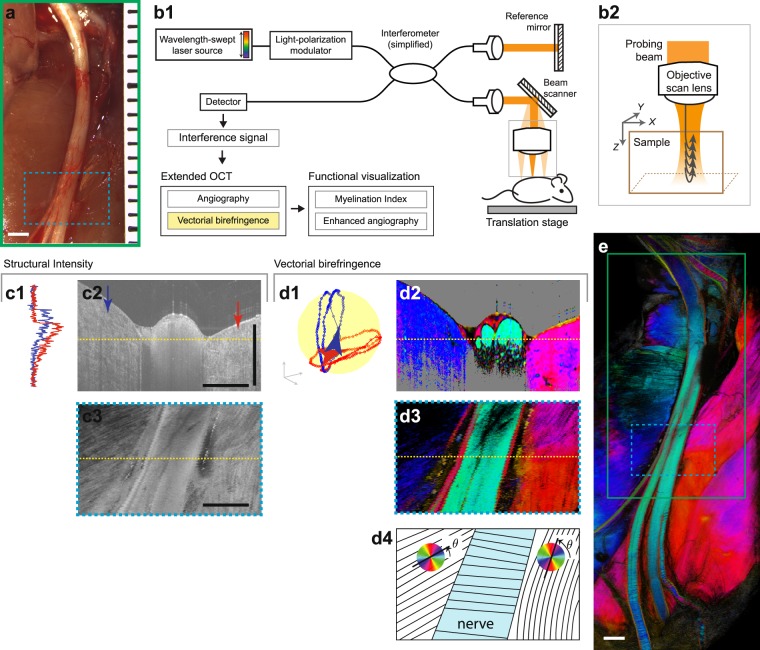
Figure 1.
Vectorial birefringence imaging of the rat sciatic nerve microenvironment by OCT. (a) A photograph of the surgically exposed rat sciatic nerve. (b) OCT imaging system. (b1), A simplified schematic. Near infrared light from wavelength-swept source is split into sample and reference paths. (b2), Reflected signals are recorded to measure the amplitude, phase, and polarization of light reflected by each depth layer of the tissue. Volume data is acquired by scanning the probing beam in XY-plane. (c) Examples of structural OCT contrast, which offers only modest contrast in peripheral nerve imaging: (c1), depth-profile of the intensity at each X-position denoted by the arrows of the same color in (c2), (c2–3), tomogram (XZ) and en face (XY) cross-sections at the locations marked by the dotted yellow lines. (d) Examples of PS-OCT and vectorial birefringence contrast. Analyzing the state of polarization (SOP) of reflected light allows localized measurement of tissue vectorial birefringence. This information can be directly displayed using cyclic colormaps and contains information on the microstructural properties (including orientation of microfiber axis in the XY-plane) of the imaged tissues: (d1), depth-trajectory of the SOP, measured at the same locations as (c1). For simplicity, one of the two incident polarization states is displayed. (d2–3), Tomogram and en face cross-sections of vectorial birefringence equivalent to (c2–3), (d4), illustration of the optic axis orientation and display colormap. (e), Wide-field vectorial birefringence imaging encompassing the nerve and surrounding tissues. All scale bars = 1 mm.

