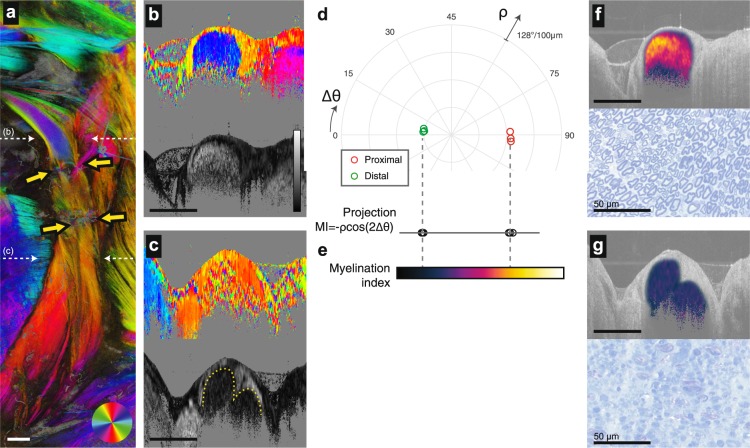
Figure 2.
Deriving a myelination index from vectorial birefringence measurements. (a) Depth-projection of vectorial birefringence of the rat sciatic nerve imaged 14 days after acellular graft repair. Coaptation points are marked by the yellow arrows. (b,c) Cross-sectional visualization of vectorial birefringence (optic axis and retardance in top and bottom panels, respectively) proximal (b) and distal (c) to the graft. Imaged sites are marked by the white dotted arrows in (a). The solid gray backgrounds in (b,c) are applied to pixels with amplitudes below a threshold intensity. (d), Polar representations of vectorial birefringence of the pixels in the fascicle. Each point is obtained from complex averaging across a manually segmented cross-section. Three cross-sections are analyzed at 1.5 mm, 2 mm and 2.5 mm proximal to the suture site (red circles), and 1.5 mm, 2 mm and 2.5 mm distal to the suture site (green circles). (e) The MI is calculated from the projection of the vectorial birefringence to the x-axis. The colormap used to visualize MI is indicated. (f,g) A visualization of MI (calculated only for intrafascicular pixels) overlay on the structural cross-section. Image sites in (f,g) correspond to those of (b,c). In the histology images, myelin is highlighted by toluidine blue staining of nerve cross section. All length scale bars = 1 mm, unless otherwise marked. For (b-c), the grayscale colorbar scales from 0 to 128 degrees retardance per 100 micrometers.

