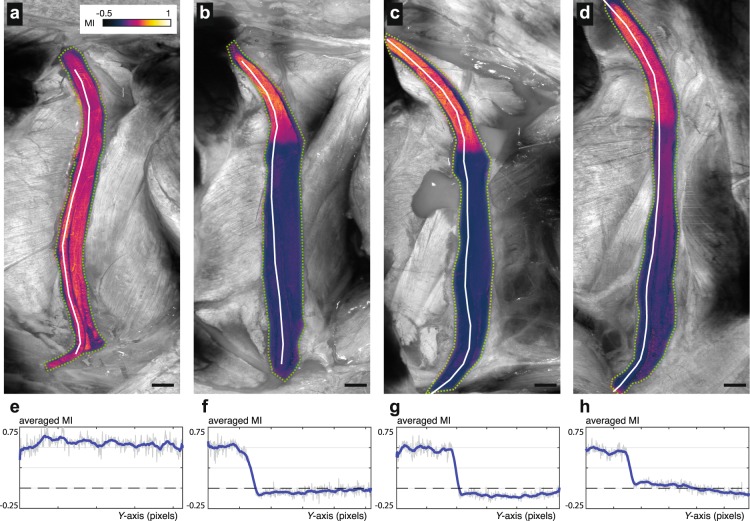
Figure 3.
Longitudinal myelination imaging following nerve crush injury. (a–d) Myelination indices across the nerve fascicles were calculated (a) immediately before injury and at (b) 7, (c) 14, and (d) 28 days after injury. Quantitative measures of MI along the nerve longitudinal axis are plotted for the common peroneal fascicles. (e–h) The quantitative MI plots corresponding to the projections displayed above in (a–d). The values are obtained from the three-dimensional centerline in the volumetric MI data. The white lines in the projection images represent this centerline. Scale bars = 1 mm.

