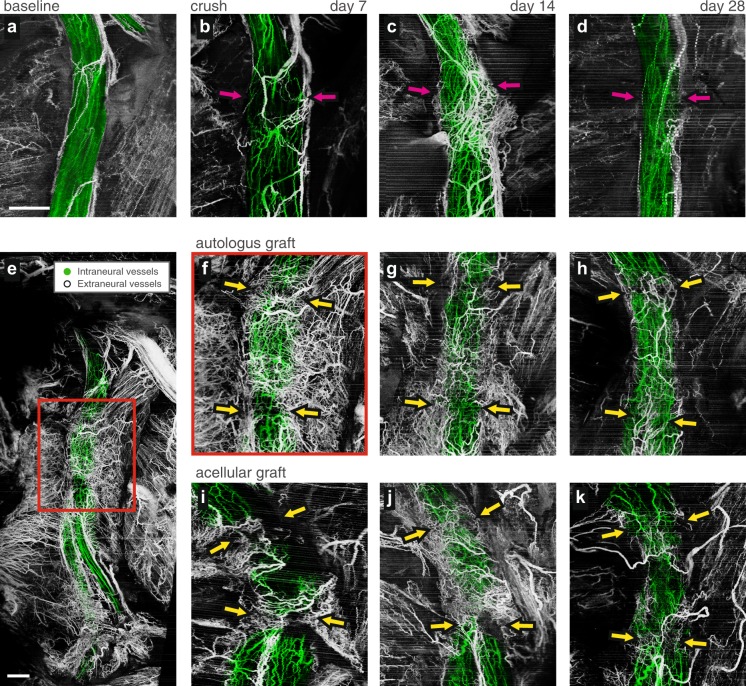
Figure 5.
Longitudinal imaging of microvasculature following nerve injury and repair. Magnified vascular projections of angiographic OCT from a same animal (a), at baseline, (b–d), 7, 14, and 28 days after a crush injury, respectively. The crush injury site is marked with the magenta arrows. (e), Wide-field vascular projection of autologous graft acquired 7 days after surgical repair. Area marked by a red rectangle is expanded in (f). The projections of equivalent magnification are presented, (f–h) following autologous graft repair, and (i–k), acellular graft repair demonstrating longitudinal monitoring of vasculature. The images were acquired 7, 14, and 28 days after the respective surgical repair, from left to right. Coaptation points are marked with the yellow arrows. All scale bars = 1 mm, all panels except (e) are of the same scale.

