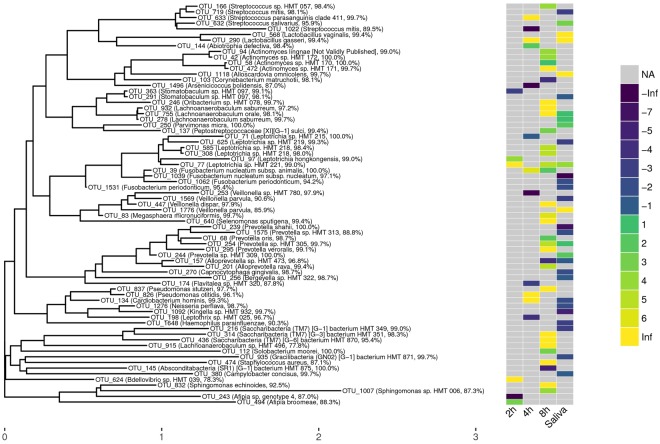
Figure 4.
Phylogenetic OTU tree created by LotuS with taxonomic assignment from the eHOMD database. Only OTUs with significantly different relative abundance are depicted with a heat map showing the log2(fold change) within the respective groups used for comparison. The values were highlighted as missing (“NA”), or colored w.r.t. their rounded value. A positive log fold-change indicates a higher relative abundance in the cavitated-caries group, a negative log fold-change stands for higher abundances in the no cavitated-caries group. Match identities according to eHOMD are given following the taxonomic name.

