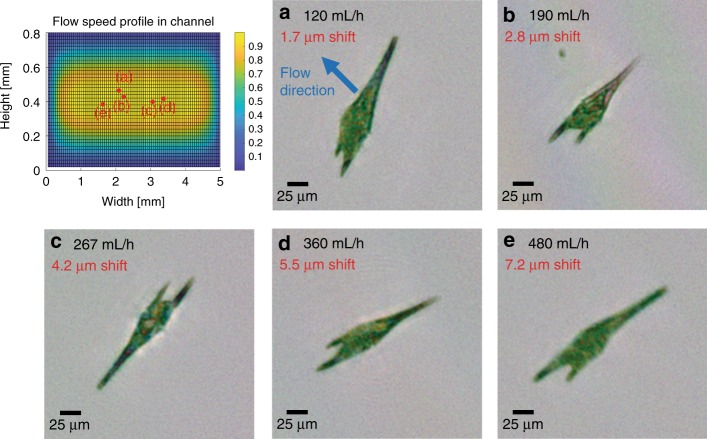
Fig. 6. Effect of increasing the liquid flow speed in the system on the image quality.
The relative flow speed profile inside the rectangular channel cross-section is depicted in the top left (see the Methods section). The measurements were made on an ocean sample containing a high concentration of Ceratium furca, which was therefore used as the model organism for this test. The sample was tested at various flow speeds above 100 mL/h with a constant 120-µs illumination pulse length. We selected the objects located inside the channel near the maximum-flow velocity regions, and their locations are depicted as red dots. a–e Reconstructed intensities corresponding to different flow rates are shown. The flow rate (black) and the theoretically calculated displacement during the illumination pulse (red) are also shown

