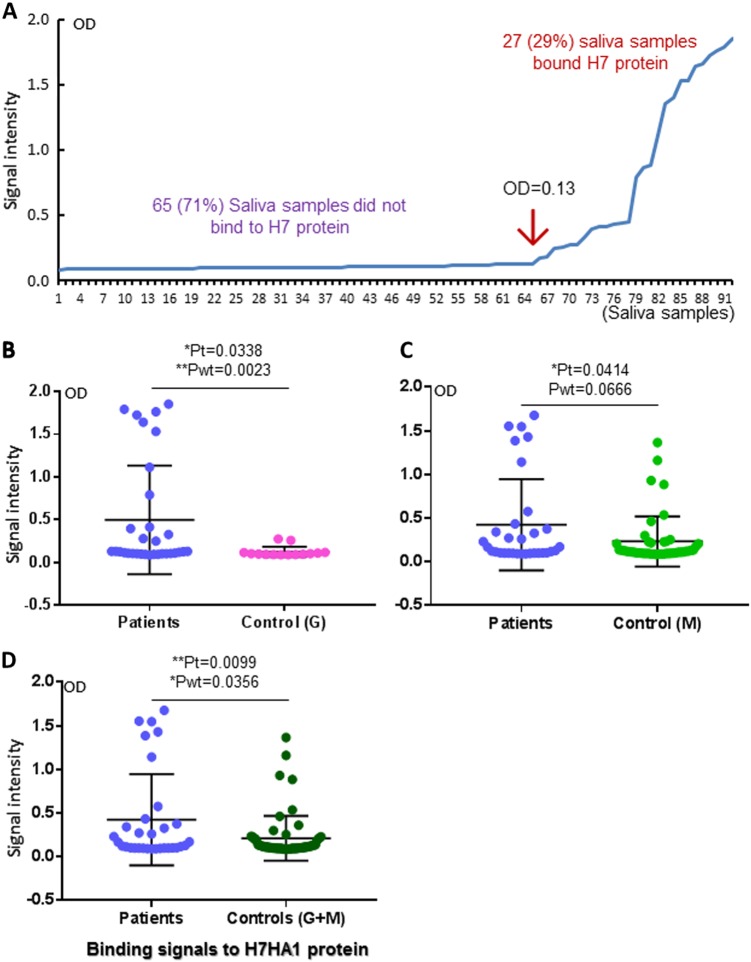
Fig. 2. Associations between the S60-HA1 protein-binding signals of the saliva samples and H7N9 virus infection.
a Results of EIA-based binding assays measuring the binding signals between the S60-HA1 protein and the 92 tested saliva samples, which were sorted by their signal intensities. The S60-HA1 particles bound 27 out of 92 (29%) tested saliva samples, but not the remaining 65 (71%) ones, segregating the saliva samples into bound and non-bound subpopulations. b–d Comparison of the S60-H7 HA1 protein-binding signals among the H7N9-infected patients vs. uninfected co-exposure control group G (b), uninfected close contact control M (c), and both G and M (d) as indicated. Y-axis indicates signal intensities, while X-axis shows the comparison combinations as indicated. The statistical differences between data groups are analyzed by t-test (t) as well as Welch’s t-test (wt) and their P values (Pt and Pwt) are shown and indicated by asterisks (*P < 0.05, **P < 0.01)

