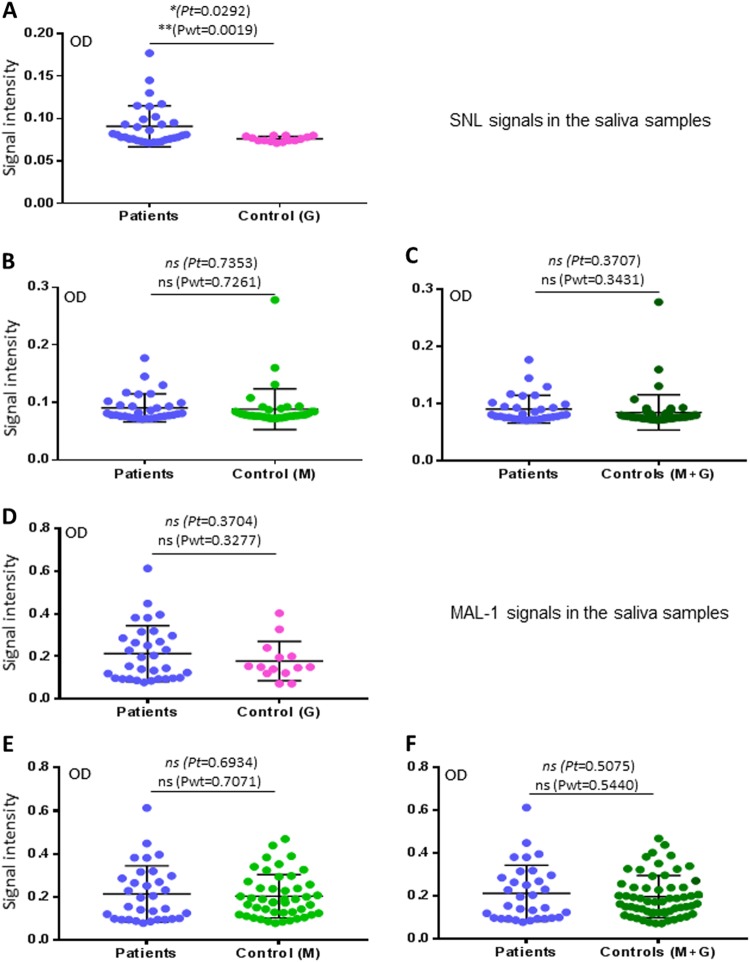
Fig. 4. Assessments of associations between the SNL- and MAL I-binding signals to saliva samples and H7N9 infection.
a–c Comparisons of the SNL-binding signals to the saliva samples between the patients and the two uninfected controls in three combinations: a patients vs. control G; b patients vs. control M; c patients vs. controls G + M. d–f Comparisons of the MAL I-binding signals to the saliva samples between the patients and the two uninfected controls in three combinations: d patients vs. control G; e patients vs. control M; f patients vs. controls G + M. Y-axis indicates signal intensities, while X-axis showed the compared experimental groups. The statistical differences between data groups are analyzed by t-test (t) as well as Welch’s t-test (wt) and their P values (Pt and Pwt) are shown and indicated by asterisks (*P < 0.05; ns, P > 0.05)

